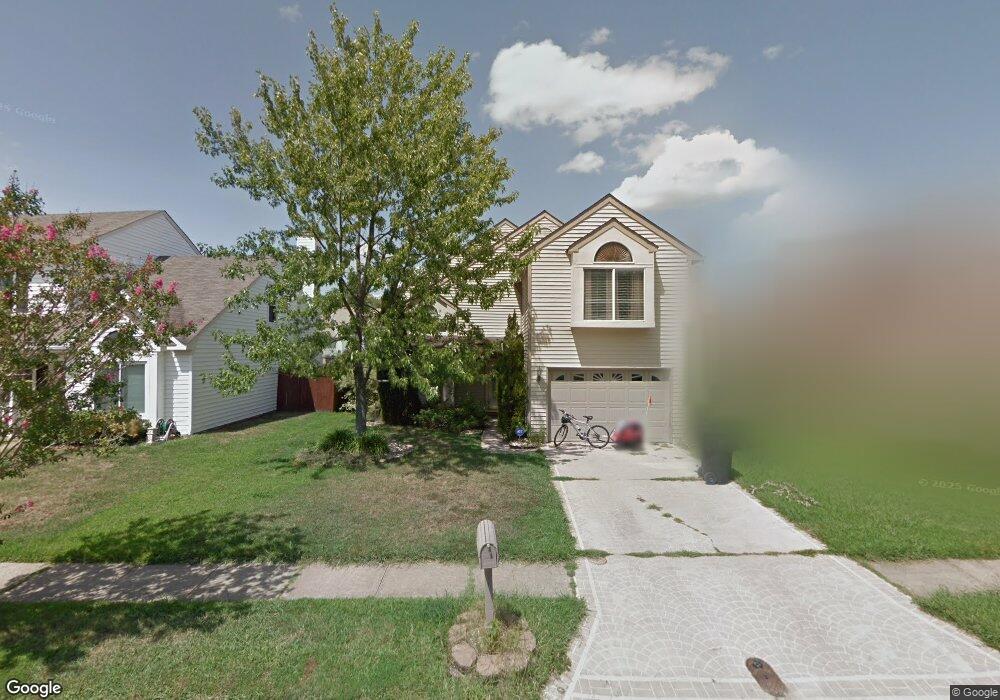
3244 Twinflower Ln Virginia Beach, VA 23453
Dam Neck NeighborhoodEstimated Value: $454,000 - $485,000
4
Beds
3
Baths
2,079
Sq Ft
$222/Sq Ft
Est. Value
About This Home
This home is located at 3244 Twinflower Ln, Virginia Beach, VA 23453 and is currently estimated at $462,378, approximately $222 per square foot. 3244 Twinflower Ln is a home located in Virginia Beach City with nearby schools including Christopher Farms Elementary School, Landstown Middle School, and Landstown High School.
Ownership History
Date
Name
Owned For
Owner Type
Purchase Details
Closed on
Jan 28, 2019
Sold by
Ffc Properties Llc
Bought by
Hendricksen Andrew D and Hendricksen Melanie
Current Estimated Value
Home Financials for this Owner
Home Financials are based on the most recent Mortgage that was taken out on this home.
Original Mortgage
$305,000
Outstanding Balance
$268,157
Interest Rate
4.6%
Mortgage Type
VA
Estimated Equity
$194,221
Purchase Details
Closed on
Sep 25, 2018
Sold by
Commonwealth Asset Services Llc
Bought by
Ffc Properties Llc
Home Financials for this Owner
Home Financials are based on the most recent Mortgage that was taken out on this home.
Original Mortgage
$218,000
Interest Rate
4.5%
Mortgage Type
Commercial
Purchase Details
Closed on
Apr 23, 2010
Sold by
Wilson Tr Lawrence E
Bought by
Johnson Andrew J
Home Financials for this Owner
Home Financials are based on the most recent Mortgage that was taken out on this home.
Original Mortgage
$291,127
Interest Rate
5%
Mortgage Type
VA
Create a Home Valuation Report for This Property
The Home Valuation Report is an in-depth analysis detailing your home's value as well as a comparison with similar homes in the area
Home Values in the Area
Average Home Value in this Area
Purchase History
| Date | Buyer | Sale Price | Title Company |
|---|---|---|---|
| Hendricksen Andrew D | $305,000 | Equity Title Co Llc | |
| Ffc Properties Llc | $218,800 | None Available | |
| Johnson Andrew J | $285,000 | -- |
Source: Public Records
Mortgage History
| Date | Status | Borrower | Loan Amount |
|---|---|---|---|
| Open | Hendricksen Andrew D | $305,000 | |
| Previous Owner | Ffc Properties Llc | $218,000 | |
| Previous Owner | Johnson Andrew J | $291,127 |
Source: Public Records
Tax History Compared to Growth
Tax History
| Year | Tax Paid | Tax Assessment Tax Assessment Total Assessment is a certain percentage of the fair market value that is determined by local assessors to be the total taxable value of land and additions on the property. | Land | Improvement |
|---|---|---|---|---|
| 2025 | $3,776 | $406,400 | $160,000 | $246,400 |
| 2024 | $3,776 | $389,300 | $160,000 | $229,300 |
| 2023 | $3,540 | $357,600 | $130,000 | $227,600 |
| 2022 | $3,303 | $333,600 | $106,000 | $227,600 |
| 2021 | $3,009 | $303,900 | $94,000 | $209,900 |
| 2020 | $2,963 | $291,200 | $94,000 | $197,200 |
| 2019 | $2,907 | $282,800 | $89,000 | $193,800 |
| 2018 | $2,835 | $282,800 | $89,000 | $193,800 |
| 2017 | $2,752 | $274,500 | $85,800 | $188,700 |
| 2016 | $2,634 | $266,100 | $85,800 | $180,300 |
| 2015 | $2,626 | $265,300 | $85,800 | $179,500 |
| 2014 | $2,229 | $250,000 | $85,800 | $164,200 |
Source: Public Records
Map
Nearby Homes
- 3129 Damascus Trail
- 2020 Aloma Dr
- 1812 Monet Ct
- 1804 Monet Ct
- 2921 Bluegrass Ln
- 3005 Winterberry Ln
- 2946 Sugar Maple Dr
- 1713 Schooner Strait Ct
- 1721 Purpose Dr
- 2921 Holm Oak Ct
- 1709 Purpose Dr
- 2812 Pleasant Acres Dr
- 2748 Christopher Farms Dr
- 1729 Chestwood Dr
- 3544 Light Horse Loop
- 3565 Purebred Dr
- 2624 Rochambeau Way
- 2413 Dunning Arch
- 2604 Saint Regis Ln
- 3617 Light Horse Loop
- 3248 Twinflower Ln
- 3240 Twinflower Ln
- 2025 Twinflower Ct
- 3252 Twinflower Ln
- 3201 Winterberry Ct
- 2021 Twinflower Ct
- 3241 Twinflower Ln
- 3245 Twinflower Ln
- 3237 Twinflower Ln
- 3249 Twinflower Ln
- 3228 Twinflower Ln
- 2017 Twinflower Ct
- 3200 Winterberry Ct
- 3260 Twinflower Ln
- 3253 Twinflower Ln
- 3205 Winterberry Ct
- 3233 Twinflower Ln
- 2024 Twinflower Ct
- 3257 Twinflower Ln
- 3224 Twinflower Ln