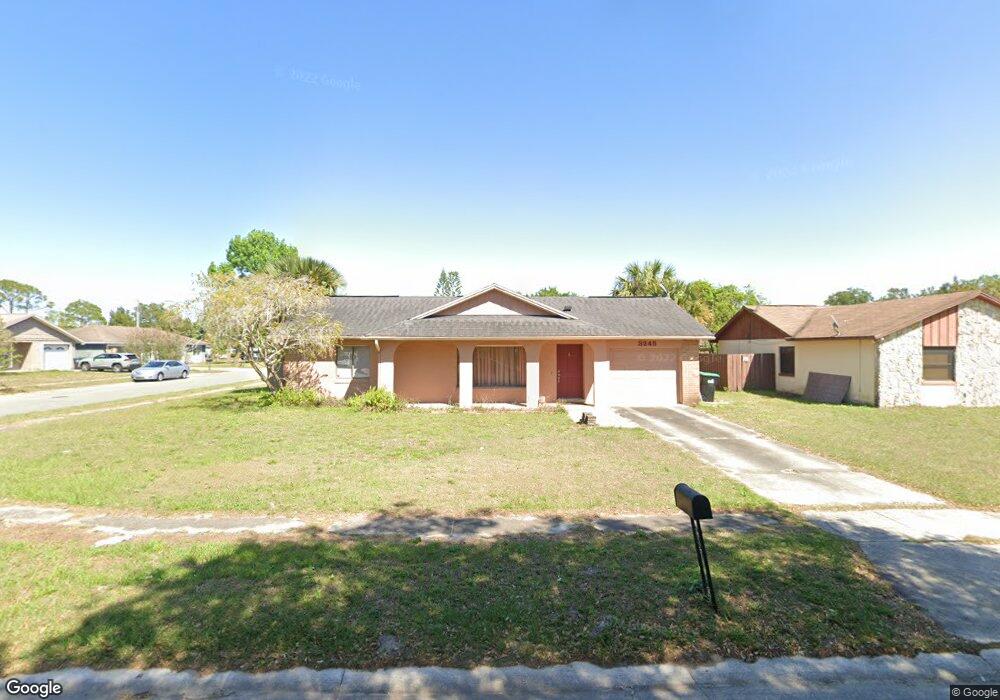
3245 Bo Jeremy Dr Orlando, FL 32822
South Semoran NeighborhoodEstimated Value: $297,326 - $340,000
3
Beds
2
Baths
1,562
Sq Ft
$206/Sq Ft
Est. Value
About This Home
This home is located at 3245 Bo Jeremy Dr, Orlando, FL 32822 and is currently estimated at $321,832, approximately $206 per square foot. 3245 Bo Jeremy Dr is a home located in Orange County with nearby schools including Three Points Elementary School, Liberty Middle School, and Colonial High School.
Ownership History
Date
Name
Owned For
Owner Type
Purchase Details
Closed on
Dec 30, 2011
Sold by
Sims Gregory J
Bought by
Lukens Jeremy S
Current Estimated Value
Home Financials for this Owner
Home Financials are based on the most recent Mortgage that was taken out on this home.
Original Mortgage
$70,000
Outstanding Balance
$48,196
Interest Rate
4.07%
Mortgage Type
New Conventional
Estimated Equity
$273,636
Purchase Details
Closed on
Jan 20, 2011
Sold by
Splaine Scott J and Splaine Lee Ann B
Bought by
Sims Gregory J
Purchase Details
Closed on
Mar 19, 1998
Sold by
Perlow Donald and Perlow Lynda A
Bought by
Splaine Scott J and Splaine Lee Ann B
Home Financials for this Owner
Home Financials are based on the most recent Mortgage that was taken out on this home.
Original Mortgage
$79,192
Interest Rate
6.99%
Mortgage Type
FHA
Purchase Details
Closed on
Dec 9, 1993
Sold by
Petrick Albert A and Petrick Patricia A Jones
Bought by
Perlow Donald and Perlow Lynda A
Create a Home Valuation Report for This Property
The Home Valuation Report is an in-depth analysis detailing your home's value as well as a comparison with similar homes in the area
Home Values in the Area
Average Home Value in this Area
Purchase History
| Date | Buyer | Sale Price | Title Company |
|---|---|---|---|
| Lukens Jeremy S | $96,000 | Equity Title Llc | |
| Sims Gregory J | $55,100 | Dba Pcs Title | |
| Splaine Scott J | $79,600 | -- | |
| Perlow Donald | $73,000 | -- |
Source: Public Records
Mortgage History
| Date | Status | Borrower | Loan Amount |
|---|---|---|---|
| Open | Lukens Jeremy S | $70,000 | |
| Previous Owner | Splaine Scott J | $90,000 | |
| Previous Owner | Splaine Scott J | $79,192 |
Source: Public Records
Tax History Compared to Growth
Tax History
| Year | Tax Paid | Tax Assessment Tax Assessment Total Assessment is a certain percentage of the fair market value that is determined by local assessors to be the total taxable value of land and additions on the property. | Land | Improvement |
|---|---|---|---|---|
| 2025 | $1,451 | $110,359 | -- | -- |
| 2024 | $1,357 | $107,249 | -- | -- |
| 2023 | $1,357 | $101,190 | $0 | $0 |
| 2022 | $1,279 | $98,243 | $0 | $0 |
| 2021 | $1,240 | $95,382 | $0 | $0 |
| 2020 | $1,178 | $94,065 | $0 | $0 |
| 2019 | $1,196 | $91,950 | $0 | $0 |
| 2018 | $2,417 | $127,006 | $30,000 | $97,006 |
| 2017 | $1,143 | $114,641 | $20,000 | $94,641 |
| 2016 | $1,114 | $104,182 | $20,000 | $84,182 |
| 2015 | $1,128 | $100,252 | $20,000 | $80,252 |
| 2014 | $1,167 | $94,109 | $20,000 | $74,109 |
Source: Public Records
Map
Nearby Homes
- 4135 Mau Ln Unit 377
- 3017 Jon Ct
- 4124 Mau Ln Unit 435
- 4119 Mau Ln Unit 369
- 4117 Mau Ln Unit 368
- 6978 Mediterranean Rd
- 7311 Mai Tai Dr Unit 316
- 6250 Pershing Ave
- 3772 Ventura Cove Dr
- 2726 Ranch House Rd Unit 89
- 7319 Kaha St
- 2721 Appaloosa Rd
- 4288 Hibiscus Bloom Dr
- 6961 Gibraltar Rd
- 7331 Kaha St Unit 358
- 6937 Gibraltar Rd
- 3900 Southpointe Dr Unit 127
- 2836 Buckboard Way Unit 159
- 3101 S Goldenrod Rd
- 2749 Ranch House Rd Unit 205
- 3253 Bo Jeremy Dr
- 3218 Jon Jon Dr
- 3226 Jon Jon Dr
- 3261 Bo Jeremy Dr
- 3222 Bo Jeremy Dr
- 3214 Bo Jeremy Dr
- 3246 Bo Jeremy Dr
- 3238 Bo Jeremy Dr
- 3254 Bo Jeremy Dr
- 3234 Jon Jon Dr
- 3206 Bo Jeremy Dr
- 3230 Bo Jeremy Dr
- 3301 Bo Jeremy Dr
- 3262 Bo Jeremy Dr
- 3304 Jon Jon Dr
- 3302 Bo Jeremy Dr
- 3217 Jon Jon Dr
- 2815 Redditt Rd
- 3225 Jon Jon Dr
- 3309 Bo Jeremy Dr