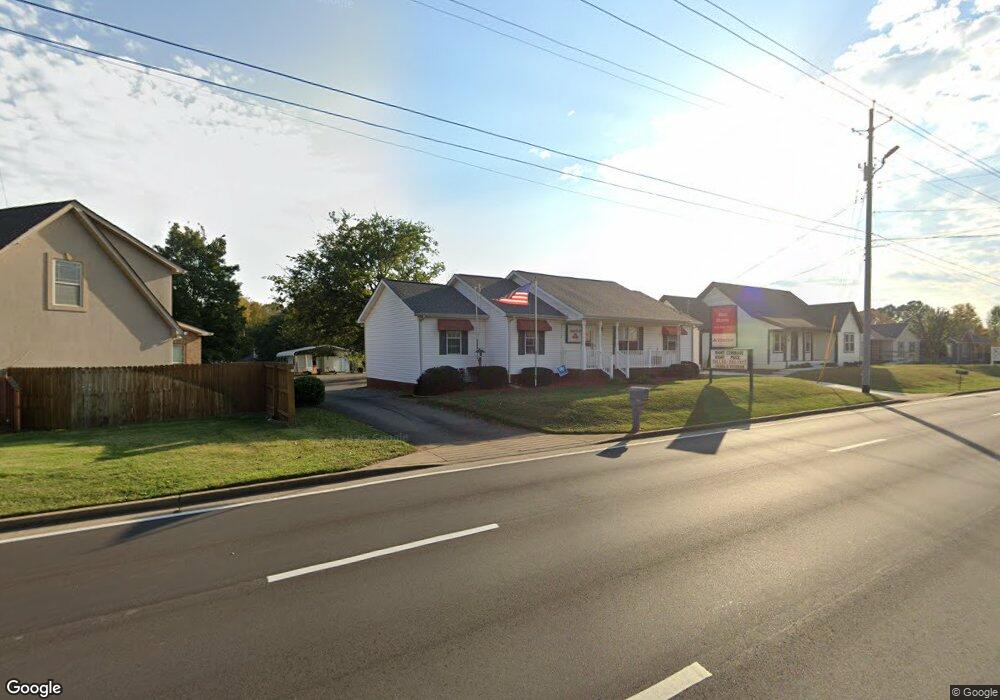
3245 Franklin Rd Murfreesboro, TN 37128
Estimated Value: $551,035
--
Bed
2
Baths
650
Sq Ft
$848/Sq Ft
Est. Value
About This Home
This home is located at 3245 Franklin Rd, Murfreesboro, TN 37128 and is currently estimated at $551,035, approximately $847 per square foot. 3245 Franklin Rd is a home located in Rutherford County with nearby schools including Rockvale Elementary School, Rockvale Middle School, and Rockvale High School.
Ownership History
Date
Name
Owned For
Owner Type
Purchase Details
Closed on
May 31, 2024
Sold by
Morris William A
Bought by
Bryant Lashawnda
Current Estimated Value
Purchase Details
Closed on
Dec 4, 2002
Sold by
Fitzgerald Bill R
Bought by
Morris William A
Purchase Details
Closed on
Mar 28, 2001
Sold by
Fitzgerald Bill R
Bought by
Poss Geneva F
Purchase Details
Closed on
Mar 27, 2001
Sold by
Poss Jerry W and Poss Geneva F
Bought by
Fitzgerald Bill R
Purchase Details
Closed on
Mar 27, 2000
Sold by
Neff & Assoc Inc
Bought by
Poss Jerry W and Poss Geneva
Purchase Details
Closed on
Oct 9, 1998
Sold by
Kay Williams Brenda
Bought by
Neff & Associates Inc
Purchase Details
Closed on
Feb 24, 1995
Sold by
Superior Built Homes
Bought by
Kay Williams Brenda
Purchase Details
Closed on
Jun 11, 1994
Sold by
Rowland & Wilson Realty Co
Bought by
Superior Built Homes
Create a Home Valuation Report for This Property
The Home Valuation Report is an in-depth analysis detailing your home's value as well as a comparison with similar homes in the area
Home Values in the Area
Average Home Value in this Area
Purchase History
| Date | Buyer | Sale Price | Title Company |
|---|---|---|---|
| Bryant Lashawnda | $550,000 | Lawyers Land & Title Services | |
| Morris William A | $101,000 | -- | |
| Fitzgerald Bill R | -- | -- | |
| Poss Geneva F | -- | -- | |
| Fitzgerald Bill R | -- | -- | |
| Poss Jerry W | $76,800 | -- | |
| Neff & Associates Inc | $56,500 | -- | |
| Kay Williams Brenda | $79,900 | -- | |
| Superior Built Homes | -- | -- |
Source: Public Records
Tax History Compared to Growth
Tax History
| Year | Tax Paid | Tax Assessment Tax Assessment Total Assessment is a certain percentage of the fair market value that is determined by local assessors to be the total taxable value of land and additions on the property. | Land | Improvement |
|---|---|---|---|---|
| 2025 | $2,699 | $143,860 | $101,200 | $42,660 |
| 2024 | $2,699 | $143,860 | $101,200 | $42,660 |
| 2023 | $2,699 | $143,860 | $101,200 | $42,660 |
| 2022 | $2,325 | $143,860 | $101,200 | $42,660 |
| 2021 | $1,311 | $59,060 | $22,760 | $36,300 |
| 2020 | $1,311 | $59,060 | $22,760 | $36,300 |
| 2019 | $1,311 | $59,060 | $22,760 | $36,300 |
| 2018 | $1,240 | $59,060 | $0 | $0 |
| 2017 | $1,462 | $54,560 | $0 | $0 |
| 2016 | $1,462 | $54,560 | $0 | $0 |
| 2015 | $1,462 | $54,560 | $0 | $0 |
| 2014 | $1,357 | $54,560 | $0 | $0 |
| 2013 | -- | $57,800 | $0 | $0 |
Source: Public Records
Map
Nearby Homes
- 3303 Hampton Turner Dr
- 228 Elderberry Way
- 328 Rockcastle Dr
- 3353 Blaze Dr
- 3402 Almar Knot Dr
- 3511 Blaze Dr
- 415 Larkspur Ln
- 2940 Waywood Dr
- 412 Conhocken Ct
- 3222 Amaranth Ave
- 3519 Boxelder Way
- 3216 Calendula Way
- 2549 Miranda Dr
- 2301 Miranda Dr
- 2905 Stonehedge Dr
- 601 Gresham Ln
- 647 Stonetrace Dr
- 725 Stonetrace Dr
- 0 Roxburghe Ct
- 4318 Roxburghe Ct
- 3261 Franklin Rd
- 102 Camden Ct
- 3277 Franklin Rd
- 106 Camden Ct
- 3295 Franklin Rd
- 3199 Franklin Rd
- 110 Camden Ct
- 3185 Franklin Rd
- 107 Camden Ct
- 3307 Franklin Rd
- 109 Camden Ct
- 109 Camden Ct
- 3167 Franklin Rd
- 29 Helen May Ct
- 3371 Franklin Rd
- 108 Franklin Heights Dr
- 112 Franklin Heights Dr
- 116 Franklin Heights Dr
- 120 Franklin Heights Dr
- 3211 Springhouse Dr