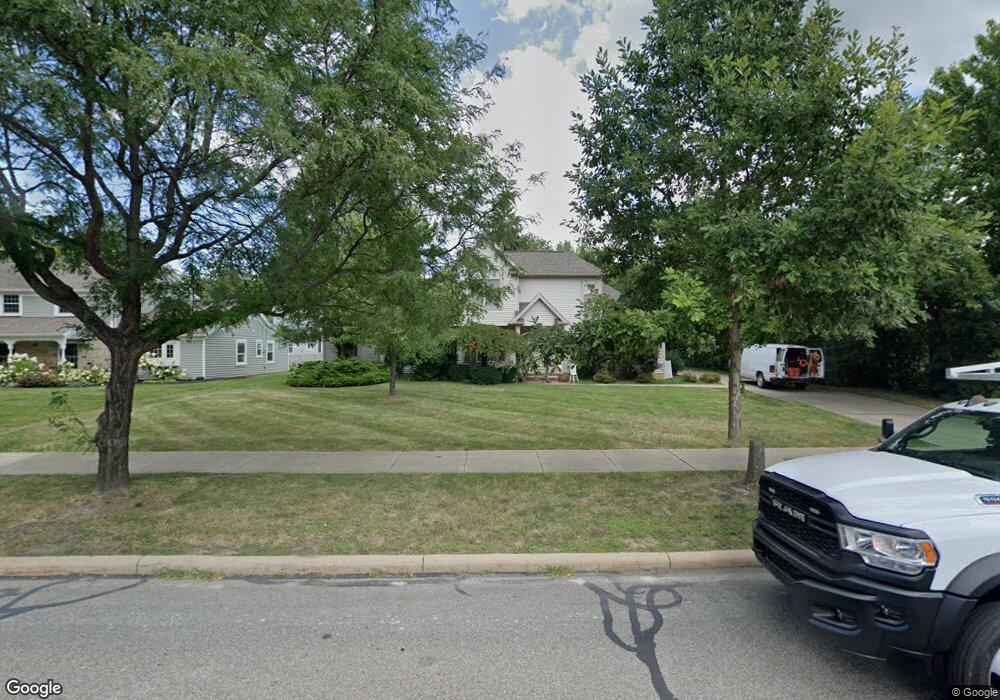
3247 Van Aken Blvd Cleveland, OH 44120
Estimated Value: $388,000 - $458,000
3
Beds
3
Baths
1,864
Sq Ft
$233/Sq Ft
Est. Value
About This Home
This home is located at 3247 Van Aken Blvd, Cleveland, OH 44120 and is currently estimated at $434,784, approximately $233 per square foot. 3247 Van Aken Blvd is a home with nearby schools including Onaway Elementary School, Woodbury Elementary School, and Shaker Heights Middle School.
Ownership History
Date
Name
Owned For
Owner Type
Purchase Details
Closed on
Aug 21, 2001
Sold by
Zannoni Steven
Bought by
Frank J Pla Inc
Current Estimated Value
Home Financials for this Owner
Home Financials are based on the most recent Mortgage that was taken out on this home.
Original Mortgage
$198,400
Interest Rate
7.28%
Mortgage Type
Purchase Money Mortgage
Purchase Details
Closed on
Mar 4, 1997
Sold by
Johnson John J
Bought by
Zannoni Steven J and Zannoni Kathleen
Home Financials for this Owner
Home Financials are based on the most recent Mortgage that was taken out on this home.
Original Mortgage
$22,000
Interest Rate
7.93%
Mortgage Type
New Conventional
Purchase Details
Closed on
Jan 31, 1985
Sold by
Johnson John J and Johnson L
Bought by
Johnson John J
Purchase Details
Closed on
Jan 1, 1975
Bought by
Johnson John J and Johnson L
Create a Home Valuation Report for This Property
The Home Valuation Report is an in-depth analysis detailing your home's value as well as a comparison with similar homes in the area
Home Values in the Area
Average Home Value in this Area
Purchase History
| Date | Buyer | Sale Price | Title Company |
|---|---|---|---|
| Frank J Pla Inc | $34,500 | Lawyers Title Ins Corp | |
| Zannoni Steven J | $31,500 | -- | |
| Johnson John J | -- | -- | |
| Johnson John J | -- | -- |
Source: Public Records
Mortgage History
| Date | Status | Borrower | Loan Amount |
|---|---|---|---|
| Previous Owner | Frank J Pla Inc | $198,400 | |
| Previous Owner | Zannoni Steven J | $22,000 |
Source: Public Records
Tax History Compared to Growth
Tax History
| Year | Tax Paid | Tax Assessment Tax Assessment Total Assessment is a certain percentage of the fair market value that is determined by local assessors to be the total taxable value of land and additions on the property. | Land | Improvement |
|---|---|---|---|---|
| 2024 | $11,034 | $132,125 | $31,150 | $100,975 |
| 2023 | $9,803 | $95,550 | $22,260 | $73,290 |
| 2022 | $9,611 | $95,550 | $22,260 | $73,290 |
| 2021 | $9,578 | $95,550 | $22,260 | $73,290 |
| 2020 | $9,428 | $89,290 | $20,790 | $68,500 |
| 2019 | $9,294 | $255,100 | $59,400 | $195,700 |
| 2018 | $9,266 | $89,290 | $20,790 | $68,500 |
| 2017 | $9,578 | $87,300 | $17,330 | $69,970 |
| 2016 | $9,198 | $87,300 | $17,330 | $69,970 |
| 2015 | $8,588 | $87,300 | $17,330 | $69,970 |
| 2014 | $8,588 | $79,350 | $15,750 | $63,600 |
Source: Public Records
Map
Nearby Homes
- 3190 Warrington Rd
- 3180 Chadbourne Rd
- 3264 E 149th St
- 14702 Milverton Rd
- 3340 Milverton Rd
- 3340 E 149th St
- 0 Van Aken Blvd Unit 5021037
- 3313 E 146th St
- 3317 E 146th St
- 3294 E 146th St
- 14506 Milverton Rd
- 3310 E 146th St
- 3291 E 145th St
- 3309 E 145th St
- 16005 Fernway Rd
- 3077 Huntington Rd
- 15610 Van Aken Blvd Unit 5
- 3155 Ludlow Rd
- 3369 E 146th St
- 3420 Westbury Rd
- 3245 Van Aken Blvd
- 3255 Van Aken Blvd
- 15200 Onaway Rd
- 15210 Onaway Rd
- 3259 Van Aken Blvd
- 3226 Chadbourne Rd
- 3230 Chadbourne Rd
- 3234 Chadbourne Rd
- 3265 Van Aken Blvd
- 3208 Chadbourne Rd
- 3238 Chadbourne Rd
- 3254 Van Aken Blvd
- 3222 Van Aken Blvd
- 3220 Van Aken Blvd
- 3218 Van Aken Blvd
- 3216 Van Aken Blvd
- 3214 Van Aken Blvd
- 3212 Van Aken Blvd
- 15015 Onaway Rd