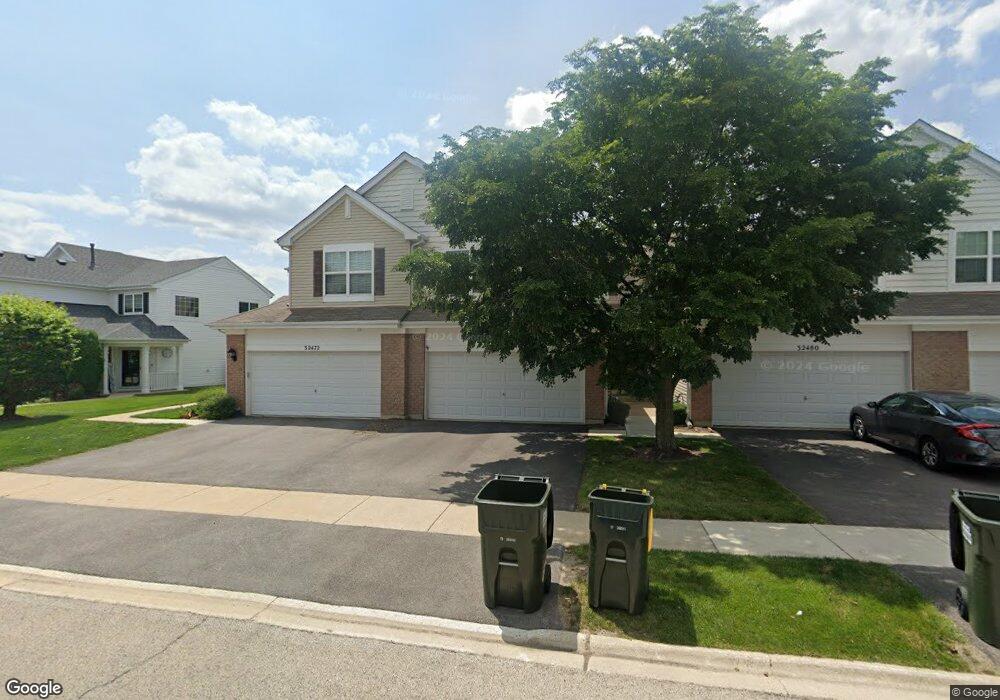
32476 N Rushmore Ave Unit 22 McHenry, IL 60051
East Lakemoor NeighborhoodEstimated Value: $255,285 - $260,000
Studio
3
Baths
1,311
Sq Ft
$196/Sq Ft
Est. Value
About This Home
This home is located at 32476 N Rushmore Ave Unit 22, McHenry, IL 60051 and is currently estimated at $256,821, approximately $195 per square foot. 32476 N Rushmore Ave Unit 22 is a home located in Lake County with nearby schools including Big Hollow Primary School, Big Hollow Elementary School, and Big Hollow Middle School.
Ownership History
Date
Name
Owned For
Owner Type
Purchase Details
Closed on
Feb 20, 2023
Sold by
Bryant Daniel
Bought by
Daniel T Bryant Revocable Trust and Joanne M Bryant Revocable Trust
Current Estimated Value
Purchase Details
Closed on
Aug 30, 2012
Sold by
Fannie Mae
Bought by
Bryant Daniel
Home Financials for this Owner
Home Financials are based on the most recent Mortgage that was taken out on this home.
Original Mortgage
$92,150
Interest Rate
4.12%
Mortgage Type
New Conventional
Purchase Details
Closed on
Mar 29, 2012
Sold by
Libera Patrick and Nationstar Mortgage Llc
Bought by
Federal National Mortgage Association
Purchase Details
Closed on
Nov 29, 2006
Sold by
Rockwell Place Llc
Bought by
Libera Patrick
Home Financials for this Owner
Home Financials are based on the most recent Mortgage that was taken out on this home.
Original Mortgage
$199,200
Interest Rate
6.33%
Mortgage Type
Purchase Money Mortgage
Create a Home Valuation Report for This Property
The Home Valuation Report is an in-depth analysis detailing your home's value as well as a comparison with similar homes in the area
Home Values in the Area
Average Home Value in this Area
Purchase History
| Date | Buyer | Sale Price | Title Company |
|---|---|---|---|
| Daniel T Bryant Revocable Trust | -- | -- | |
| Bryant Daniel | $97,000 | First American Title | |
| Federal National Mortgage Association | -- | None Available | |
| Libera Patrick | $206,000 | First American Title Ins Co |
Source: Public Records
Mortgage History
| Date | Status | Borrower | Loan Amount |
|---|---|---|---|
| Previous Owner | Bryant Daniel | $92,150 | |
| Previous Owner | Libera Patrick | $199,200 |
Source: Public Records
Tax History
| Year | Tax Paid | Tax Assessment Tax Assessment Total Assessment is a certain percentage of the fair market value that is determined by local assessors to be the total taxable value of land and additions on the property. | Land | Improvement |
|---|---|---|---|---|
| 2024 | $4,867 | $76,431 | $8,306 | $68,125 |
| 2023 | $5,186 | $63,012 | $7,825 | $55,187 |
| 2022 | $5,186 | $58,594 | $5,576 | $53,018 |
| 2021 | $5,109 | $55,231 | $5,256 | $49,975 |
| 2020 | $4,532 | $54,442 | $5,181 | $49,261 |
| 2019 | $4,369 | $52,207 | $4,968 | $47,239 |
| 2018 | $2,850 | $36,672 | $5,567 | $31,105 |
| 2017 | $2,765 | $33,896 | $5,146 | $28,750 |
| 2016 | $2,759 | $31,000 | $4,706 | $26,294 |
| 2015 | $2,632 | $28,929 | $4,392 | $24,537 |
| 2014 | $2,684 | $26,059 | $4,193 | $21,866 |
| 2012 | $3,814 | $30,956 | $4,370 | $26,586 |
Source: Public Records
Map
Nearby Homes
- 32456 N Mackinac Ln Unit 245
- 32018 Savannah Dr
- 28200 W Il Route 120
- 32012 Savannah Dr
- 32069 Savannah Dr
- 32006 W Savannah Dr
- 32075 Savannah Dr
- 31998 W Savannah Dr
- 28609 Augusta Ln
- 32865 N Us Highway 12
- 27 Oyster Bay
- 32504 Millstone Cir
- 311 Red Oak Cir
- 27419 W Molidor Rd
- 31782 N Pineview Blvd
- 359 Red Oak Cir
- 409 Red Oak Cir
- Charlotte Plan at Oaks of Volo - Traditional Townhomes
- Marianne Plan at Oaks of Volo - Traditional Townhomes
- Chatham Plan at Oaks of Volo - Urban Townhomes
- 32476 N Rushmore Ave Unit 1
- 32480 N Rushmore Ave Unit 23
- 32480 N Rushmore Ave Unit 1
- 32484 N Rushmore Ave Unit 24
- 32466 N Rushmore Ave Unit 16
- 32466 N Rushmore Ave Unit 1
- 32488 N Rushmore Ave Unit 25
- 32462 N Rushmore Ave Unit 15
- 32492 N Rushmore Ave Unit 26
- 32458 N Rushmore Ave Unit 14
- 32458 N Rushmore Ave Unit 1
- 32454 N Rushmore Ave Unit 13
- 32479 N Rushmore Ave Unit 163
- 32479 N Rushmore Ave Unit 1
- 32475 N Rushmore Ave Unit 162
- 32450 N Rushmore Ave Unit 12
- 32471 N Rushmore Ave Unit 161
- 32483 N Rushmore Ave Unit 164
- 32508 N Rushmore Ave Unit 32
Your Personal Tour Guide
Ask me questions while you tour the home.