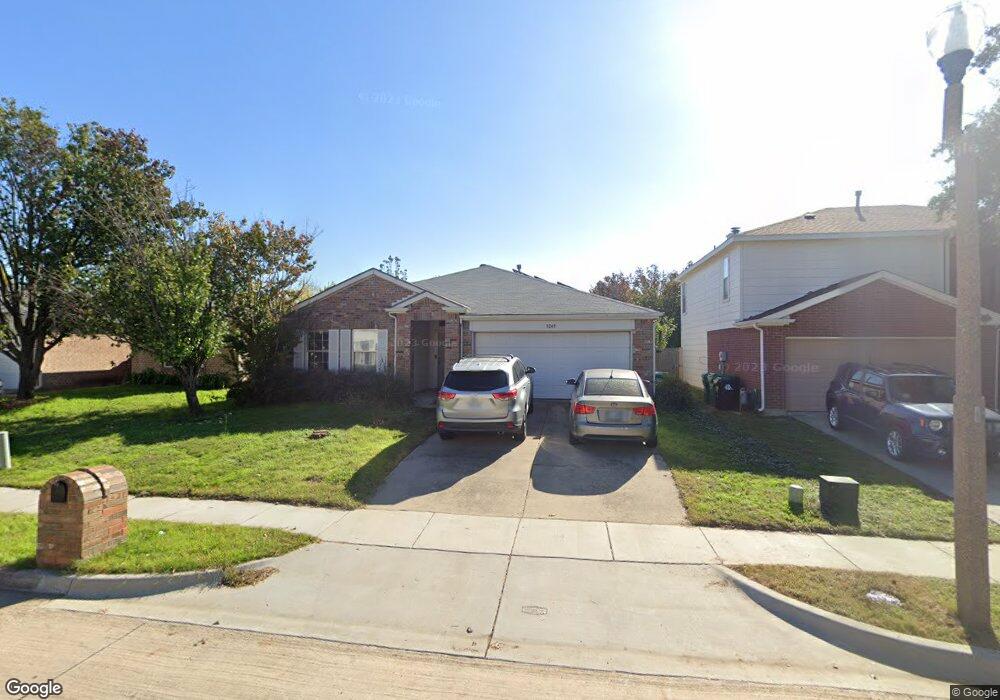
3249 Bent Creek Dr Denton, TX 76210
South Denton NeighborhoodEstimated Value: $301,941 - $328,000
3
Beds
2
Baths
1,761
Sq Ft
$179/Sq Ft
Est. Value
About This Home
This home is located at 3249 Bent Creek Dr, Denton, TX 76210 and is currently estimated at $315,735, approximately $179 per square foot. 3249 Bent Creek Dr is a home located in Denton County with nearby schools including Ryan Elementary School, McMath Middle School, and Denton High School.
Ownership History
Date
Name
Owned For
Owner Type
Purchase Details
Closed on
Mar 11, 2020
Sold by
Walter Eric
Bought by
Walter Eric and Walter Kathryn L
Current Estimated Value
Home Financials for this Owner
Home Financials are based on the most recent Mortgage that was taken out on this home.
Original Mortgage
$150,000
Outstanding Balance
$132,079
Interest Rate
3.2%
Mortgage Type
Credit Line Revolving
Estimated Equity
$183,656
Purchase Details
Closed on
Aug 26, 2011
Sold by
Keaton Michael D and Keaton Loretta S
Bought by
Walter Eric
Home Financials for this Owner
Home Financials are based on the most recent Mortgage that was taken out on this home.
Original Mortgage
$108,575
Interest Rate
4.5%
Mortgage Type
FHA
Purchase Details
Closed on
May 25, 2000
Sold by
Pulte Homes Of Texas Lp
Bought by
Keaton Michael D and Keaton Loretta S
Home Financials for this Owner
Home Financials are based on the most recent Mortgage that was taken out on this home.
Original Mortgage
$121,240
Interest Rate
8.17%
Mortgage Type
FHA
Create a Home Valuation Report for This Property
The Home Valuation Report is an in-depth analysis detailing your home's value as well as a comparison with similar homes in the area
Home Values in the Area
Average Home Value in this Area
Purchase History
| Date | Buyer | Sale Price | Title Company |
|---|---|---|---|
| Walter Eric | -- | None Available | |
| Walter Eric | -- | Stewart | |
| Keaton Michael D | -- | -- |
Source: Public Records
Mortgage History
| Date | Status | Borrower | Loan Amount |
|---|---|---|---|
| Open | Walter Eric | $150,000 | |
| Closed | Walter Eric | $108,575 | |
| Previous Owner | Keaton Michael D | $121,240 |
Source: Public Records
Tax History Compared to Growth
Tax History
| Year | Tax Paid | Tax Assessment Tax Assessment Total Assessment is a certain percentage of the fair market value that is determined by local assessors to be the total taxable value of land and additions on the property. | Land | Improvement |
|---|---|---|---|---|
| 2025 | $3,938 | $290,956 | $66,000 | $224,956 |
| 2024 | $5,134 | $265,983 | $0 | $0 |
| 2023 | $3,420 | $241,803 | $66,000 | $248,549 |
| 2022 | $4,666 | $219,821 | $66,000 | $193,000 |
| 2021 | $4,442 | $199,837 | $38,500 | $161,337 |
| 2020 | $4,642 | $203,076 | $38,500 | $164,576 |
| 2019 | $4,793 | $200,872 | $38,500 | $166,003 |
| 2018 | $4,411 | $182,611 | $38,500 | $147,049 |
| 2017 | $4,103 | $166,010 | $38,500 | $134,387 |
| 2016 | $3,730 | $150,918 | $27,500 | $125,725 |
| 2015 | $2,894 | $137,198 | $27,500 | $109,698 |
| 2013 | -- | $114,784 | $22,000 | $92,784 |
Source: Public Records
Map
Nearby Homes
- 3304 Teasbend Ct
- 3108 Spenrock Ct
- 3109 Pecan Tree Dr
- 3105 Pecan Tree Dr
- 3108 Pinehurst Ct
- 400 Regency Ct
- 301 Fairmount Ct
- 3309 Del Mar Dr
- 409 Meadowlands Dr
- 3200 Belmont St
- Type - 2 Plan at Ryan Woods
- 100 Bentwood Ct
- 2608 Tamarack Ln
- 2808 Tamarack Ln
- 2620 Tamarack Ln
- 2616 Tamarack Ln
- 21 Wellington Oaks Cir
- 4212 Stonetrail Dr
- 5004 Greenbrook Rd
- 28 Timbergreen Cir
- 3245 Bent Creek Dr
- 3253 Bent Creek Dr
- 3257 Bent Creek Dr
- 3241 Bent Creek Dr
- 1132 Wintercreek Dr
- 1136 Wintercreek Dr
- 1140 Wintercreek Dr
- 1128 Wintercreek Dr
- 3261 Bent Creek Dr
- 3248 Bent Creek Dr
- 1200 Wintercreek Dr
- 3244 Bent Creek Dr
- 3252 Bent Creek Dr
- 3229 Bent Creek Dr
- 3240 Bent Creek Dr
- 1124 Wintercreek Dr
- 3256 Bent Creek Dr
- 3301 Bent Creek Dr
- 1204 Wintercreek Dr
- 3236 Bent Creek Dr