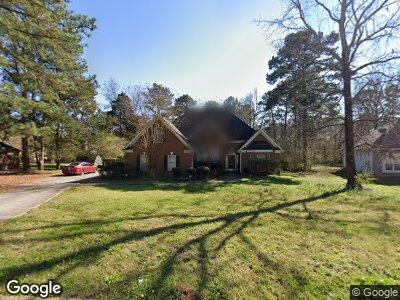
3249 Lindas Cir SE Conyers, GA 30013
Estimated Value: $321,985 - $391,000
4
Beds
3
Baths
2,456
Sq Ft
$142/Sq Ft
Est. Value
About This Home
This home is located at 3249 Lindas Cir SE, Conyers, GA 30013 and is currently estimated at $349,746, approximately $142 per square foot. 3249 Lindas Cir SE is a home located in Rockdale County with nearby schools including Peek's Chapel Elementary School, Memorial Middle School, and Salem High School.
Ownership History
Date
Name
Owned For
Owner Type
Purchase Details
Closed on
Jun 23, 2022
Sold by
Sfr Investments V Borrower 1 Llc
Bought by
Progress Residential Borrower 20 Llc
Current Estimated Value
Purchase Details
Closed on
Jan 31, 2022
Sold by
Forge Damion Vernard
Bought by
Sfr Investments V Borrower 1 Llc
Purchase Details
Closed on
Nov 1, 2021
Sold by
Thompkins Tommie Mae Estate
Bought by
Forge Damion Vernard
Purchase Details
Closed on
Sep 29, 2011
Sold by
Federal National Mortgage Association
Bought by
Thompkins Tommie M
Purchase Details
Closed on
Mar 1, 2011
Sold by
Wells Fargo Bk Na
Bought by
Federal Natl Mtg Assn Fnma
Purchase Details
Closed on
Dec 30, 2002
Sold by
York Ben H and York Christa C
Bought by
Sparks Richard K and Sparks Ida
Home Financials for this Owner
Home Financials are based on the most recent Mortgage that was taken out on this home.
Original Mortgage
$174,300
Interest Rate
3.25%
Mortgage Type
New Conventional
Create a Home Valuation Report for This Property
The Home Valuation Report is an in-depth analysis detailing your home's value as well as a comparison with similar homes in the area
Home Values in the Area
Average Home Value in this Area
Purchase History
| Date | Buyer | Sale Price | Title Company |
|---|---|---|---|
| Progress Residential Borrower 20 Llc | -- | -- | |
| Sfr Investments V Borrower 1 Llc | $285,000 | -- | |
| Forge Damion Vernard | -- | -- | |
| Thompkins Tommie M | $109,400 | -- | |
| Federal Natl Mtg Assn Fnma | $181,279 | -- | |
| Wells Fargo Bk Na | $181,729 | -- | |
| Sparks Richard K | $183,500 | -- |
Source: Public Records
Mortgage History
| Date | Status | Borrower | Loan Amount |
|---|---|---|---|
| Previous Owner | Sparks Richard K | $178,887 | |
| Previous Owner | Sparks Richard K | $50,445 | |
| Previous Owner | Sparks Richard K | $52,000 | |
| Previous Owner | Sparks Richard K | $174,300 |
Source: Public Records
Tax History Compared to Growth
Tax History
| Year | Tax Paid | Tax Assessment Tax Assessment Total Assessment is a certain percentage of the fair market value that is determined by local assessors to be the total taxable value of land and additions on the property. | Land | Improvement |
|---|---|---|---|---|
| 2024 | $5,641 | $142,400 | $24,800 | $117,600 |
| 2023 | $4,656 | $137,000 | $25,440 | $111,560 |
| 2022 | $4,840 | $118,640 | $24,160 | $94,480 |
| 2021 | $3,973 | $97,800 | $17,400 | $80,400 |
| 2020 | $3,781 | $88,320 | $17,760 | $70,560 |
| 2019 | $3,091 | $68,480 | $10,800 | $57,680 |
| 2018 | $1,032 | $63,880 | $10,800 | $53,080 |
| 2017 | $919 | $59,880 | $10,800 | $49,080 |
| 2016 | $1,317 | $59,880 | $10,800 | $49,080 |
| 2015 | $1,111 | $52,680 | $9,320 | $43,360 |
| 2014 | $840 | $46,640 | $8,000 | $38,640 |
| 2013 | -- | $43,760 | $9,050 | $34,709 |
Source: Public Records
Map
Nearby Homes
- 3284 Salem Ln SE
- 6005 Spring Way SE
- 6015 Spring Way SE
- 3348 Concord Corner SE
- 1917 Kevin Dr SE
- 3281 Old Salem Rd SE
- 3225 Haleys Way SE
- 2507 Fairweather Ct SE
- 2509 Fairweather Ct SE
- 2505 Westchester Way SE
- 3222 Haleys Way SE
- 3434 Estels Ln SE
- 1736 Salem Woods Dr SE
- 3444 Underwood Ct SE
- 3346 Salem East Dr SE
- 3440 Concord Corner SE
- 1995 Evergreen Dr SE
- 3249 Lindas Cir SE
- 3247 Lindas Cir SE
- 2357 Benji Blvd SE
- 2359 Benji Blvd SE
- 2361 Benji Blvd SE
- 3245 Lindas Cir SE
- 3250 Old Salem Rd SE
- 3252 Old Salem Rd SE
- 3246 Lindas Cir SE
- 2355 Benji Blvd SE
- 0 Ben's Cir SE
- 3248 Old Salem Rd SE
- 2363 Benji Blvd SE
- 3244 Lindas Cir SE
- 2348 Benji Blvd SE
- 2350 Benji Blvd SE
- 3243 Lindas Cir SE
- 3246 Old Salem Rd SE
- 2353 Benji Blvd SE
- 2354 Benji Blvd SE