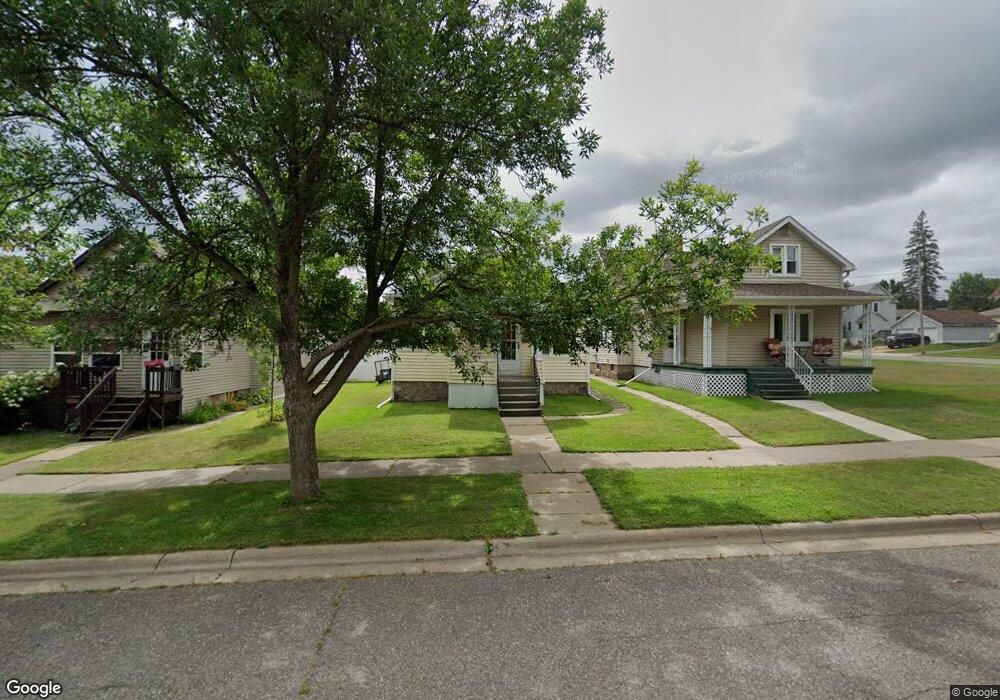
325 3rd St NW Chisholm, MN 55719
Estimated Value: $76,000 - $124,000
2
Beds
1
Bath
887
Sq Ft
$110/Sq Ft
Est. Value
About This Home
This home is located at 325 3rd St NW, Chisholm, MN 55719 and is currently estimated at $97,595, approximately $110 per square foot. 325 3rd St NW is a home located in St. Louis County with nearby schools including Vaughan Elementary School, Chisholm Elementary School, and Chisholm Secondary School.
Ownership History
Date
Name
Owned For
Owner Type
Purchase Details
Closed on
Nov 24, 2008
Sold by
Sertich Anthony J and Sertich Tallie
Bought by
Johnson Steven M
Current Estimated Value
Home Financials for this Owner
Home Financials are based on the most recent Mortgage that was taken out on this home.
Original Mortgage
$63,654
Outstanding Balance
$41,348
Interest Rate
5.87%
Mortgage Type
FHA
Estimated Equity
$56,247
Purchase Details
Closed on
Jun 20, 2001
Sold by
Levchak Michael C and Levchak Evelyn A
Bought by
Sertich Anthony J
Home Financials for this Owner
Home Financials are based on the most recent Mortgage that was taken out on this home.
Original Mortgage
$46,400
Interest Rate
7.16%
Create a Home Valuation Report for This Property
The Home Valuation Report is an in-depth analysis detailing your home's value as well as a comparison with similar homes in the area
Home Values in the Area
Average Home Value in this Area
Purchase History
| Date | Buyer | Sale Price | Title Company |
|---|---|---|---|
| Johnson Steven M | $64,090 | Up North Title Inc | |
| Johnson Steven M | $64,090 | Up North Title Inc | |
| Sertich Anthony J | $49,000 | -- | |
| Sertich Anthony J | $49,000 | -- |
Source: Public Records
Mortgage History
| Date | Status | Borrower | Loan Amount |
|---|---|---|---|
| Open | Johnson Steven M | $63,654 | |
| Previous Owner | Sertich Anthony J | $46,400 |
Source: Public Records
Tax History Compared to Growth
Tax History
| Year | Tax Paid | Tax Assessment Tax Assessment Total Assessment is a certain percentage of the fair market value that is determined by local assessors to be the total taxable value of land and additions on the property. | Land | Improvement |
|---|---|---|---|---|
| 2024 | $420 | $77,500 | $5,500 | $72,000 |
| 2023 | $420 | $100,200 | $7,000 | $93,200 |
| 2022 | $250 | $62,600 | $4,600 | $58,000 |
| 2021 | $260 | $51,100 | $2,800 | $48,300 |
| 2020 | $208 | $48,200 | $2,800 | $45,400 |
| 2019 | $218 | $46,300 | $2,800 | $43,500 |
| 2018 | $186 | $46,300 | $2,800 | $43,500 |
| 2017 | $226 | $46,200 | $2,700 | $43,500 |
| 2016 | $222 | $50,100 | $3,800 | $46,300 |
| 2015 | $309 | $28,700 | $2,300 | $26,400 |
| 2014 | $309 | $29,600 | $2,300 | $27,300 |
Source: Public Records
Map
Nearby Homes