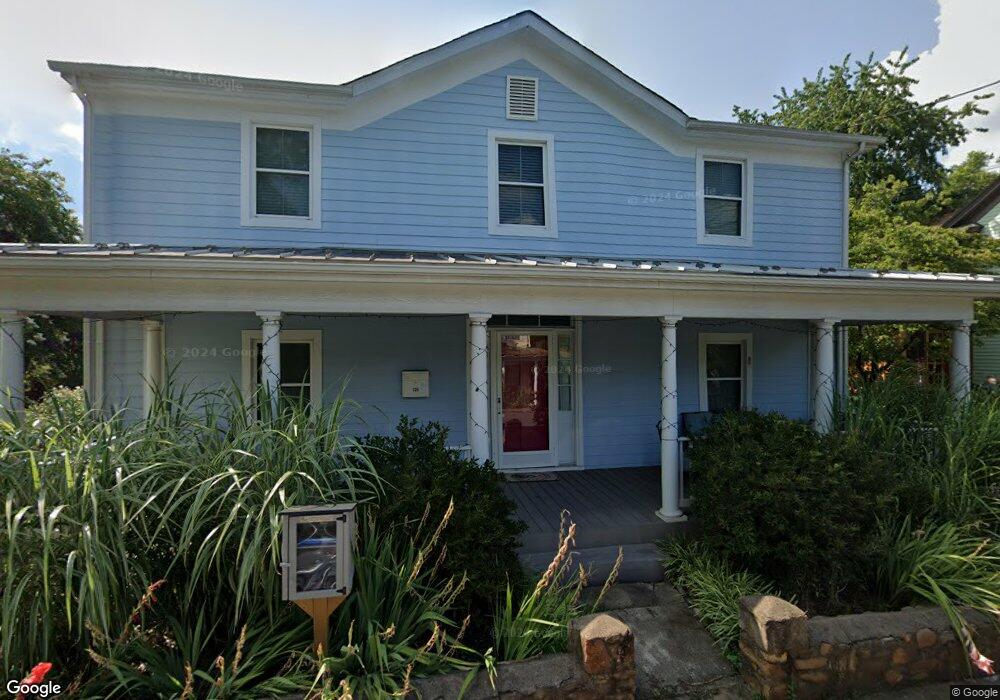
325 7 1/2 St SW Charlottesville, VA 22903
Fifeville NeighborhoodEstimated Value: $644,000 - $723,418
3
Beds
2
Baths
2,853
Sq Ft
$238/Sq Ft
Est. Value
About This Home
This home is located at 325 7 1/2 St SW, Charlottesville, VA 22903 and is currently estimated at $678,855, approximately $237 per square foot. 325 7 1/2 St SW is a home located in Charlottesville City with nearby schools including Johnson Elementary School, Buford Middle School, and Charlottesville High School.
Ownership History
Date
Name
Owned For
Owner Type
Purchase Details
Closed on
Jun 1, 2016
Sold by
Richard Handler
Bought by
Bottel Matthew and Bottel Colby
Current Estimated Value
Purchase Details
Closed on
Nov 12, 2008
Bought by
Handler Richard and Wendy Zomparelli
Create a Home Valuation Report for This Property
The Home Valuation Report is an in-depth analysis detailing your home's value as well as a comparison with similar homes in the area
Home Values in the Area
Average Home Value in this Area
Purchase History
| Date | Buyer | Sale Price | Title Company |
|---|---|---|---|
| Bottel Matthew | $422,000 | Stewart Title Guaranty Co | |
| Handler Richard | -- | -- |
Source: Public Records
Mortgage History
| Date | Status | Borrower | Loan Amount |
|---|---|---|---|
| Closed | Bottel Matthew | $320,000 |
Source: Public Records
Tax History Compared to Growth
Tax History
| Year | Tax Paid | Tax Assessment Tax Assessment Total Assessment is a certain percentage of the fair market value that is determined by local assessors to be the total taxable value of land and additions on the property. | Land | Improvement |
|---|---|---|---|---|
| 2025 | $6,397 | $633,700 | $149,500 | $484,200 |
| 2024 | $6,397 | $618,600 | $143,800 | $474,800 |
| 2023 | $5,829 | $587,700 | $132,300 | $455,400 |
| 2022 | $5,253 | $527,700 | $109,300 | $418,400 |
| 2021 | $4,855 | $491,300 | $114,200 | $377,100 |
| 2020 | $4,799 | $485,400 | $112,000 | $373,400 |
| 2019 | $4,708 | $475,900 | $109,800 | $366,100 |
| 2018 | $2,148 | $432,600 | $99,800 | $332,800 |
| 2017 | $4,297 | $432,591 | $99,800 | $332,791 |
| 2016 | $4,029 | $404,400 | $81,800 | $322,600 |
| 2015 | $4,053 | $404,400 | $81,800 | $322,600 |
| 2014 | $4,053 | $421,200 | $85,200 | $336,000 |
Source: Public Records
Map
Nearby Homes
- 329 7 1/2 St SW
- 317 7 1/2 St SW
- 331 7 1/2 St SW
- 708 Nalle St
- 712 Nalle St
- 753 King St
- 324 7 1 2 St SW
- 716 Nalle St
- 315 7 1/2 St SW
- 328 7 1/2 St SW
- 324 7 1/2 St SW
- 320 7 1/2 St SW
- 720 Nalle St
- 755 King St Unit B
- 755 King St Unit A
- 755 King St
- 801 Cherry Ave
- 336 7 1 2 St SW
- 316 7 1/2 St SW
- 332 7 1/2 St SW