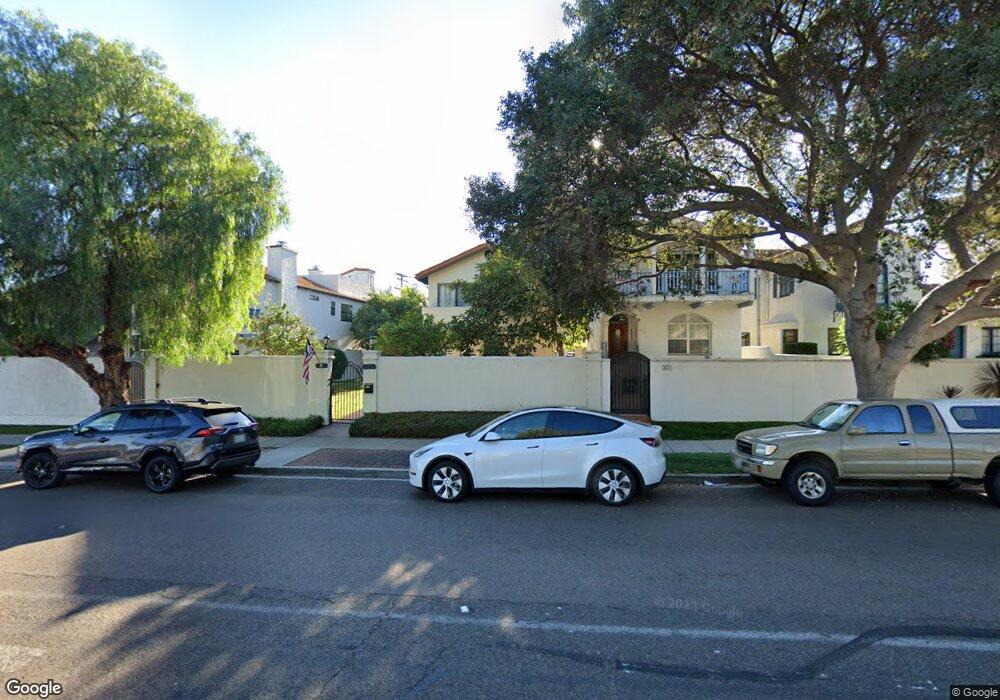
325 Alameda Blvd Coronado, CA 92118
Estimated Value: $3,076,000 - $4,533,000
6
Beds
4
Baths
3,395
Sq Ft
$1,123/Sq Ft
Est. Value
About This Home
This home is located at 325 Alameda Blvd, Coronado, CA 92118 and is currently estimated at $3,811,184, approximately $1,122 per square foot. 325 Alameda Blvd is a home located in San Diego County with nearby schools including Coronado Village Elementary, Coronado Middle School, and Coronado High School.
Ownership History
Date
Name
Owned For
Owner Type
Purchase Details
Closed on
Dec 31, 2008
Sold by
Scanlon John Sylvester Anthony and Scanlon Jane Marie Moody
Bought by
Scanlon John Sylvester Anthony and Scanlon Jane Marie Moody
Current Estimated Value
Home Financials for this Owner
Home Financials are based on the most recent Mortgage that was taken out on this home.
Original Mortgage
$366,292
Interest Rate
5.97%
Mortgage Type
Stand Alone Refi Refinance Of Original Loan
Purchase Details
Closed on
Dec 17, 1997
Sold by
Scanlon John A and Scanlon Jane M
Bought by
Scanlon John Sylvester Anthony and Scanlon Jane Marie Moody
Purchase Details
Closed on
Nov 8, 1996
Sold by
Scanlon Joseph P
Bought by
Scanlon John A and Scanlon Jane M
Purchase Details
Closed on
Sep 25, 1996
Sold by
Scanlon John A and Scanlon Jane M
Bought by
Scanlon John Sylvester Anthony and Scanlon Jane Marie Moody
Create a Home Valuation Report for This Property
The Home Valuation Report is an in-depth analysis detailing your home's value as well as a comparison with similar homes in the area
Home Values in the Area
Average Home Value in this Area
Purchase History
| Date | Buyer | Sale Price | Title Company |
|---|---|---|---|
| Scanlon John Sylvester Anthony | -- | None Available | |
| Scanlon John Sylvester Anthony | -- | Lawyers Title Of San Diego | |
| Scanlon John Sylvester Anthony | -- | -- | |
| Scanlon John A | -- | -- | |
| Scanlon John Sylvester Anthony | -- | -- |
Source: Public Records
Mortgage History
| Date | Status | Borrower | Loan Amount |
|---|---|---|---|
| Closed | Scanlon John Sylvester Anthony | $366,292 |
Source: Public Records
Tax History Compared to Growth
Tax History
| Year | Tax Paid | Tax Assessment Tax Assessment Total Assessment is a certain percentage of the fair market value that is determined by local assessors to be the total taxable value of land and additions on the property. | Land | Improvement |
|---|---|---|---|---|
| 2025 | $7,919 | $646,114 | $175,427 | $470,687 |
| 2024 | $7,919 | $633,446 | $171,988 | $461,458 |
| 2023 | $7,808 | $621,026 | $168,616 | $452,410 |
| 2022 | $7,680 | $608,850 | $165,310 | $443,540 |
| 2021 | $7,582 | $596,913 | $162,069 | $434,844 |
| 2020 | $7,399 | $590,794 | $160,408 | $430,386 |
| 2019 | $7,378 | $579,211 | $157,263 | $421,948 |
| 2018 | $7,270 | $567,855 | $154,180 | $413,675 |
| 2017 | $7,088 | $556,721 | $151,157 | $405,564 |
| 2016 | $6,831 | $545,806 | $148,194 | $397,612 |
| 2015 | $6,669 | $537,608 | $145,968 | $391,640 |
| 2014 | $6,377 | $527,078 | $143,109 | $383,969 |
Source: Public Records
Map
Nearby Homes