NOT LISTED FOR SALE

325 April Ct Charlestown, IN 47111

Estimated Value: $170,000 - $229,000

3 Beds
1 Bath
975 Sq Ft
$191/Sq Ft Est. Value

Last Sold April 05, 2019

Last sale price $100,000 $103 Per Sq Ft

Est. 86% increase in value since last sale

Current estimated payment $1,053/month

Highlights

  • Eat-In Kitchen
  • 1-Story Property
  • Forced Air Heating and Cooling System
  • Patio
  • Landscaped
  • Ceiling Fan

About This Home

As of April 2019

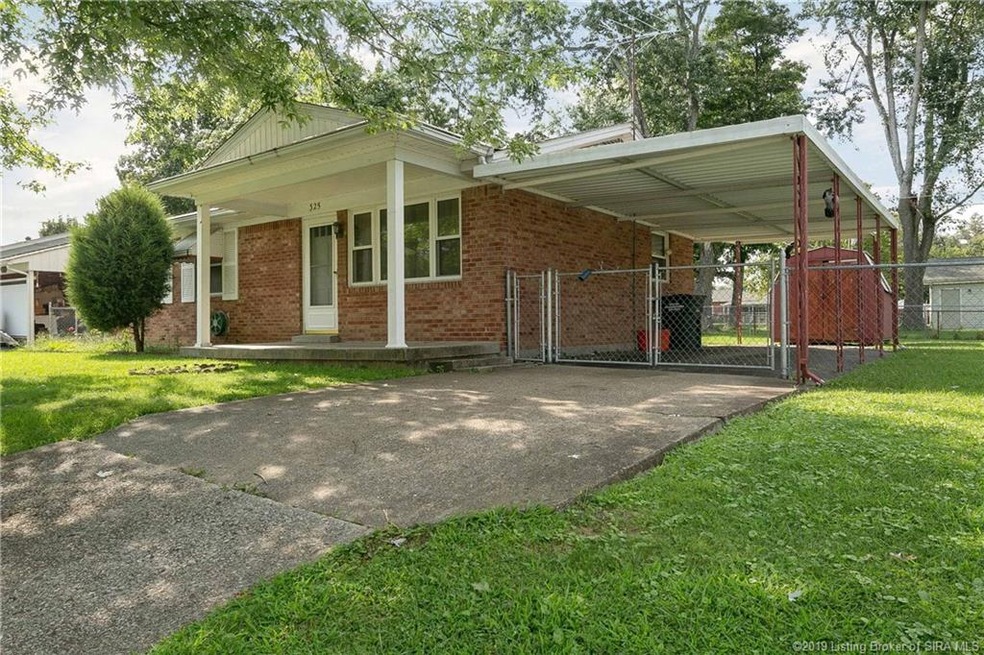
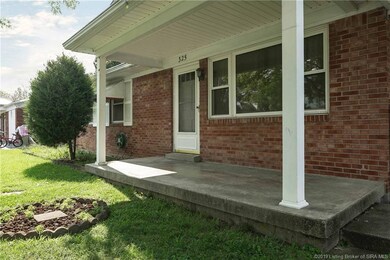
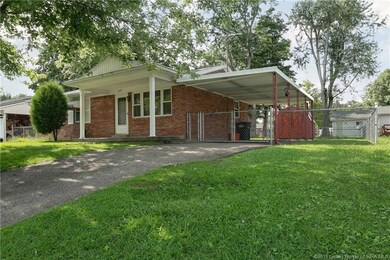
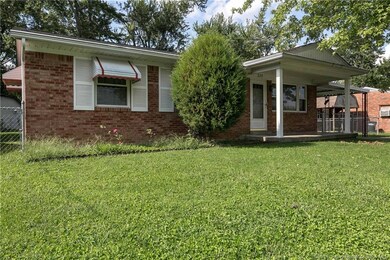
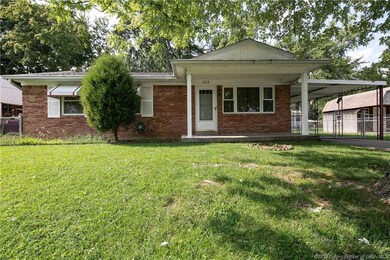
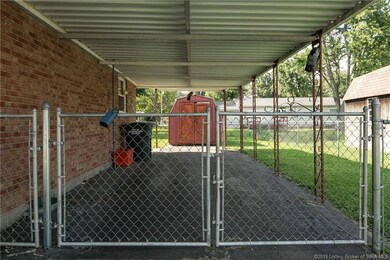
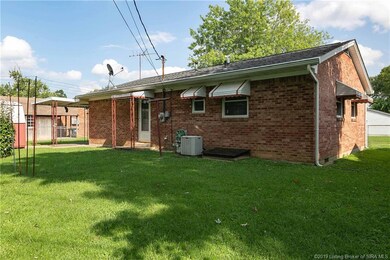
This cute brick ranch sits on a dead-end street, and it features 3 bedrooms, 1 bathroom, and an eat-in kitchen. Mature trees, attached carport, and large, fenced backyard with shed! Conveniently located near schools and Charlestown State Park. Square feet is approx.; if critical, buyers should verify.

Last Agent to Sell the Property

Stephannie Wilson

NextHome Wilson Real Estate License #RB14039714 Listed on: 02/07/2019

Last Buyer's Agent

Ruth Stewart

License #RB17000508

Home Details

Home Type

  • Single Family

Est. Annual Taxes

  • $1,234

Year Built

  • Built in 1966

Lot Details

  • 6,970 Sq Ft Lot
  • Landscaped

Home Design

  • Frame Construction

Interior Spaces

  • 975 Sq Ft Home
  • 1-Story Property
  • Ceiling Fan

Kitchen

  • Eat-In Kitchen
  • Oven or Range

Bedrooms and Bathrooms

  • 3 Bedrooms
  • 1 Full Bathroom

Parking

  • Carport
  • Off-Street Parking

Outdoor Features

  • Patio

Utilities

  • Forced Air Heating and Cooling System
  • Gas Available
  • Natural Gas Water Heater
  • Cable TV Available

Listing and Financial Details

  • Assessor Parcel Number 101813600236000004

Home Details

Home Type

Single Family

Est. Annual Taxes

$1,234

Year Built

Built in 1966

Lot Details

0

Listing Details

  • Improvements: 53100
  • Additional Parking: Off Street
  • Annual Tax: 1234
  • Appointment: Mandatory
  • Construction: Frame On-Site
  • Land Assessment: 11000
  • Legal Description: LOT 2 DORIE SUBD
  • Open House Count: 1
  • Parcel Number: 101813600236000004
  • Property Sub Type: Residential
  • Property Type: Residential/Farm
  • Total: 64100
  • Total Finished Square Footage: 975
  • Type: 1 Story
  • Year Built: 1966
  • Special Features: None

Interior Features

  • Water Heater: Natural Gas
  • Above Grade Finished Sq Ft: 975.00
  • Appliances: Range / Oven, Refrigerator
  • Full Bathrooms: 1
  • Total Bathrooms: 1.00
  • Total Bedrooms: 3
  • Interior Amenities: 1st Floor Master, Cable Wired, Ceiling Fan(s), Eat-In Kitchen
  • Lot Sq Ft: 6969.60
  • Room Count: 5
  • Sewer Type: Sewer
  • Total Sq Ft: 975
  • Total Rooms: 5

Exterior Features

  • Exterior Features: Landscaped, Patio

Garage/Parking

  • Garage Type: Carport

Utilities

  • Cooling Type: Central Air
  • Fuel Type: Gas
  • Heat Type: Forced Air
  • Water Type: Public Onsite

Schools

  • School District: Greater Clark

Lot Info

  • Acres: 0.1600
  • Zoning: Residential

Ownership History

Date Name Owned For Owner Type

Purchase Details

Listed on
Feb 7, 2019
Closed on
Apr 5, 2019
Sold by
Yss Properties Llc
Bought by
Skyrm Dion J
Seller's Agent
Stephannie Wilson
NextHome Wilson Real Estate
Buyer's Agent
Ruth Stewart
List Price
$103,900
Sold Price
$100,000
Premium/Discount to List
-$3,900
-3.75%
Current Estimated Value
$186,010

Home Financials for this Owner

Home Financials are based on the most recent Mortgage that was taken out on this home.
Estimated Appreciation
$86,010
Avg. Annual Appreciation
10.02%

Purchase Details

Closed on
Feb 18, 2010
Sold by
Henderson Carmaline B
Bought by
Ross James P
Source: Public Records

Range of Values:

Collateral Analytics

Collateral Analytics Collateral Analytics AVMs (Automated Valuation Model) employ a number of statistical approaches combined with neighborhood-specific comparable selection guarantees the most up-to-date and precise valuations.

Not Available

Collateral Analytics does not have data for the current month. Please view the chart for historical values.

ICE

ICE Mortgage Technology ICE Mortgage Technology’s AVM (Automated Valuation Model) is a state-of-the-art online residential property valuation tool that provides a quick and accurate estimate of the value of almost any home in the U.S.

Not Available

ICE Mortgage Technology does not have data for the current month. Please view the chart for historical values.

First American

First American First American Data & Analytics’ next-generation AVM combines unrivaled data assets with a blended ensemble of valuation models to produce highly accurate, reliable valuations you can trust.

Not Available

First American does not have data for the current month. Please view the chart for historical values.

Quantarium

Quantarium Quantarium’s valuation service, repeatedly proven the industry’s most accurate and comprehensive, is supercharged with a self-learning and auto-tuning AI engine that continually becomes smarter and more accurate as it processes daily inputs from the industry’s leading RE data lake.

Not Available

Quantarium does not have data for the current month. Please view the chart for historical values.

Average Value
Not Available
List Price
Sold Price
Create a Home Valuation Report for This Property
The Home Valuation Report is an in-depth analysis detailing your home's value as well as a comparison with similar homes in the area

Home Values in the Area

Source: Public Records

Average Home Value in this Area


Source: Public Records

Purchase History

Date Buyer Sale Price Title Company
Skyrm Dion J -- --
Ross James P $61,000 --
Source: Public Records

Property History

Date Event Price Change Sq Ft Price
04/05/2019 04/05/19 Sold $100,000 -3.8% $103 / Sq Ft
03/02/2019 03/02/19 Pending -- -- --
02/07/2019 02/07/19 For Sale $103,900 -- $107 / Sq Ft
Source: Southern Indiana REALTORS® Association

Tax History Compared to Growth

Source: Public Records

Tax History

Year Tax Paid Tax Assessment Tax Assessment Total Assessment is a certain percentage of the fair market value that is determined by local assessors to be the total taxable value of land and additions on the property. Land Improvement
2024 $802 $107,600 $26,000 $81,600
2023 $802 $106,600 $26,000 $80,600
2022 $753 $101,900 $19,500 $82,400
2021 $449 $80,100 $13,000 $67,100
2020 $391 $74,500 $11,000 $63,500
2019 $347 $69,200 $11,000 $58,200
2018 $1,285 $64,100 $11,000 $53,100
2017 $1,234 $61,600 $11,000 $50,600
2016 $1,314 $65,600 $11,000 $54,600
2014 $1,288 $64,300 $11,000 $53,300
2013 -- $62,500 $11,000 $51,500
Source: Public Records

Agents Affiliated with this Home

  • Section Image
  • Section Image
See All Agents

Map

Source: Southern Indiana REALTORS® Association

MLS Number: 201905754

Southern Indiana REALTORS® Association

APN: 10-18-13-600-236.000-004