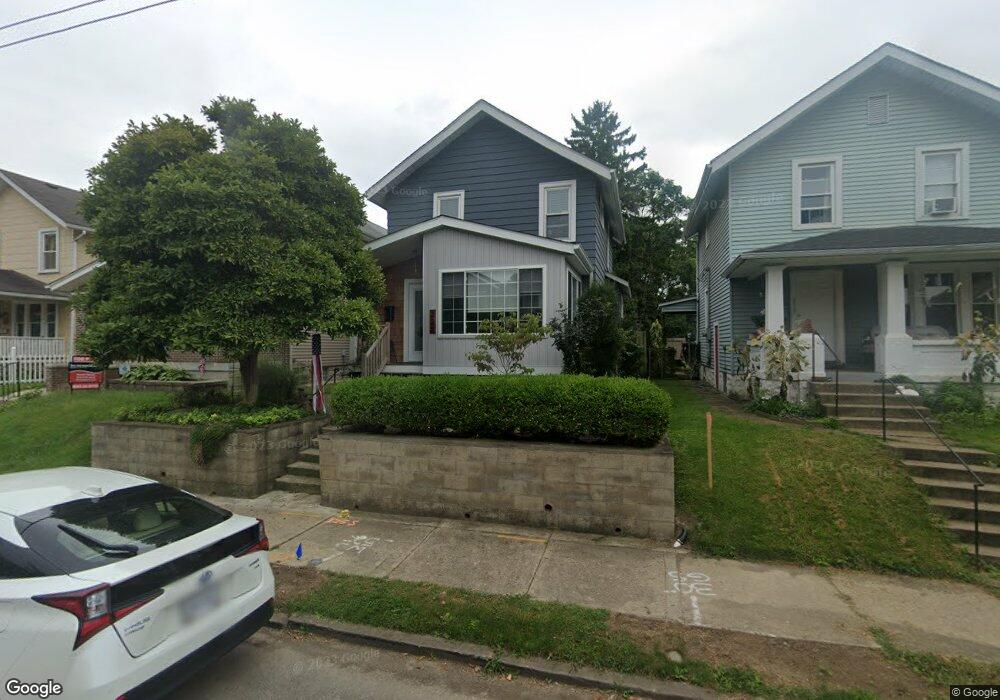
325 E Hinman Ave Columbus, OH 43207
Reeb-Hosack/Hungarian Village NeighborhoodEstimated Value: $162,000 - $214,000
2
Beds
1
Bath
984
Sq Ft
$198/Sq Ft
Est. Value
About This Home
This home is located at 325 E Hinman Ave, Columbus, OH 43207 and is currently estimated at $194,743, approximately $197 per square foot. 325 E Hinman Ave is a home located in Franklin County with nearby schools including Southwood Elementary School, South High School, and South Columbus Preparatory Academy.
Ownership History
Date
Name
Owned For
Owner Type
Purchase Details
Closed on
Dec 12, 2023
Sold by
Ansted Steven D
Bought by
Piccioni Charles Dante
Current Estimated Value
Purchase Details
Closed on
Oct 4, 2023
Sold by
Ansted Steven D
Bought by
Piccioni Charles Dante
Purchase Details
Closed on
Jul 15, 2002
Sold by
Anderson Troy and Anderson Kristyn M
Bought by
Ansted Steven D
Home Financials for this Owner
Home Financials are based on the most recent Mortgage that was taken out on this home.
Original Mortgage
$67,000
Outstanding Balance
$27,475
Interest Rate
6.8%
Mortgage Type
Purchase Money Mortgage
Estimated Equity
$167,268
Purchase Details
Closed on
Sep 29, 2000
Sold by
Tully Alice S
Bought by
Anderson Troy and Anderson Kristyn M
Home Financials for this Owner
Home Financials are based on the most recent Mortgage that was taken out on this home.
Original Mortgage
$56,500
Interest Rate
7.99%
Purchase Details
Closed on
Nov 8, 1996
Sold by
Clemens Pat Lee
Bought by
Alice Tully
Home Financials for this Owner
Home Financials are based on the most recent Mortgage that was taken out on this home.
Original Mortgage
$25,500
Interest Rate
8.26%
Mortgage Type
New Conventional
Create a Home Valuation Report for This Property
The Home Valuation Report is an in-depth analysis detailing your home's value as well as a comparison with similar homes in the area
Home Values in the Area
Average Home Value in this Area
Purchase History
| Date | Buyer | Sale Price | Title Company |
|---|---|---|---|
| Piccioni Charles Dante | $200,000 | None Listed On Document | |
| Piccioni Charles Dante | $200,000 | None Listed On Document | |
| Ansted Steven D | $67,000 | Amerititle | |
| Anderson Troy | $56,500 | Midland Celtic Title | |
| Alice Tully | $30,000 | -- |
Source: Public Records
Mortgage History
| Date | Status | Borrower | Loan Amount |
|---|---|---|---|
| Open | Ansted Steven D | $67,000 | |
| Previous Owner | Anderson Troy | $56,500 | |
| Previous Owner | Alice Tully | $25,500 |
Source: Public Records
Tax History
| Year | Tax Paid | Tax Assessment Tax Assessment Total Assessment is a certain percentage of the fair market value that is determined by local assessors to be the total taxable value of land and additions on the property. | Land | Improvement |
|---|---|---|---|---|
| 2025 | $2,925 | $65,180 | $19,220 | $45,960 |
| 2024 | $2,925 | $65,180 | $19,220 | $45,960 |
| 2023 | $3,043 | $68,670 | $19,215 | $49,455 |
| 2022 | $2,549 | $49,140 | $10,780 | $38,360 |
| 2021 | $2,553 | $49,140 | $10,780 | $38,360 |
| 2020 | $2,460 | $47,290 | $10,780 | $36,510 |
| 2019 | $2,030 | $33,460 | $7,980 | $25,480 |
| 2018 | $1,751 | $33,460 | $7,980 | $25,480 |
| 2017 | $2,029 | $33,460 | $7,980 | $25,480 |
| 2016 | $1,626 | $24,540 | $5,460 | $19,080 |
| 2015 | $1,476 | $24,540 | $5,460 | $19,080 |
| 2014 | $1,479 | $24,540 | $5,460 | $19,080 |
| 2013 | $811 | $27,265 | $6,055 | $21,210 |
Source: Public Records
Map
Nearby Homes
- 332 E Hinman Ave
- 330 E Morrill Ave
- 379 E Morrill Ave
- 1624 S 8th St
- 1696 Parsons Ave
- 1692 Parsons Ave
- 1756 Bruck St
- 464 E Hinman Ave
- 236 E Welch Ave
- 457 E Woodrow Ave Unit 459
- 220 E Welch Ave
- 177 E Hinman Ave
- 172 E Woodrow Ave
- 495 E Welch Ave
- 1563 S 6th St
- 218 E Markison Ave
- 149 E Hinman Ave
- 1808 S 6th St Unit 810
- 1657 Ann St
- 292 E Barthman Ave
- 327 E Hinman Ave
- 319 E Hinman Ave
- 331 E Hinman Ave
- 315 E Hinman Ave
- 311 E Hinman Ave
- 335 E Hinman Ave
- 339 E Hinman Ave
- 307 E Hinman Ave
- 322 E Woodrow Ave
- 343 E Hinman Ave
- 318 E Woodrow Ave
- 328 E Woodrow Ave
- 345 E Hinman Ave
- 303 E Hinman Ave
- 330 E Woodrow Ave Unit 332
- 314 E Woodrow Ave
- 310 E Woodrow Ave
- 334 E Woodrow Ave
- 326 E Hinman Ave
- 322 E Hinman Ave
Your Personal Tour Guide
Ask me questions while you tour the home.