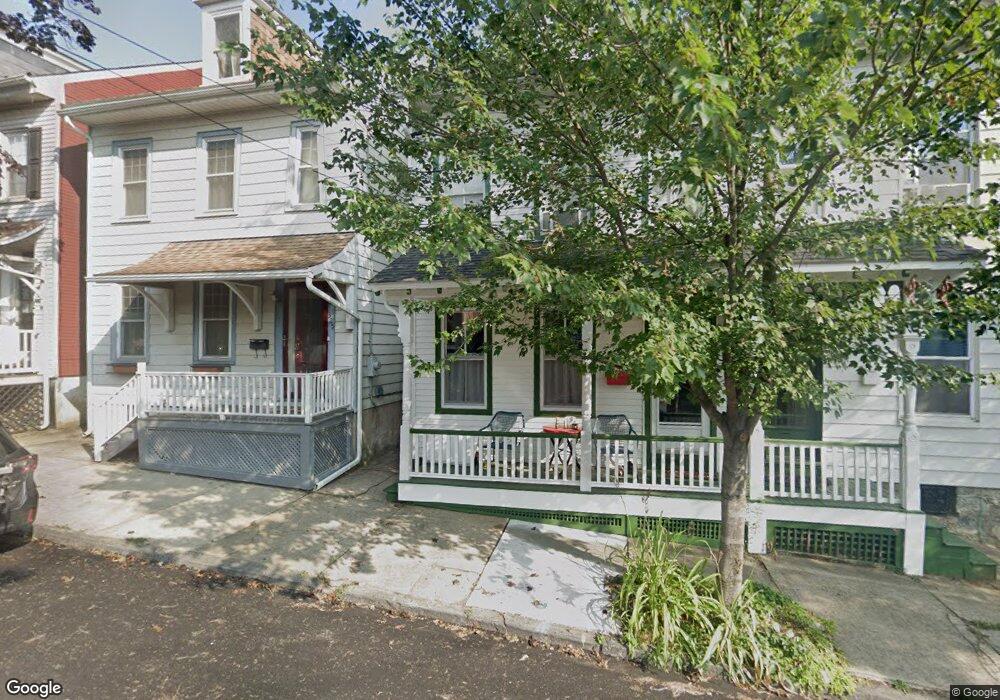
325 High St Easton, PA 18042
College Hill NeighborhoodEstimated Value: $305,000 - $360,000
3
Beds
1
Bath
1,756
Sq Ft
$188/Sq Ft
Est. Value
About This Home
This home is located at 325 High St, Easton, PA 18042 and is currently estimated at $330,674, approximately $188 per square foot. 325 High St is a home located in Northampton County with nearby schools including Francis A. March Elementary School, Easton Area Middle School, and Easton Area High School.
Ownership History
Date
Name
Owned For
Owner Type
Purchase Details
Closed on
Jul 19, 2019
Sold by
Albulescu Eugene O
Bought by
Albulescu Eugene O and Albulescu Linda Carol Ganus
Current Estimated Value
Home Financials for this Owner
Home Financials are based on the most recent Mortgage that was taken out on this home.
Original Mortgage
$153,000
Outstanding Balance
$100,448
Interest Rate
3.82%
Mortgage Type
New Conventional
Estimated Equity
$230,226
Purchase Details
Closed on
Apr 22, 2009
Sold by
Albulescu Eugene O and Adrienne Jennifer K
Bought by
Albulescu Eugene O
Purchase Details
Closed on
Jul 18, 2007
Sold by
Warner Charles E
Bought by
Albulescu Eugene O
Home Financials for this Owner
Home Financials are based on the most recent Mortgage that was taken out on this home.
Original Mortgage
$214,000
Interest Rate
6.54%
Mortgage Type
New Conventional
Create a Home Valuation Report for This Property
The Home Valuation Report is an in-depth analysis detailing your home's value as well as a comparison with similar homes in the area
Home Values in the Area
Average Home Value in this Area
Purchase History
| Date | Buyer | Sale Price | Title Company |
|---|---|---|---|
| Albulescu Eugene O | -- | Greater Pa Abstract | |
| Albulescu Eugene O | -- | None Available | |
| Albulescu Eugene O | $214,000 | -- |
Source: Public Records
Mortgage History
| Date | Status | Borrower | Loan Amount |
|---|---|---|---|
| Open | Albulescu Eugene O | $153,000 | |
| Closed | Albulescu Eugene O | $214,000 |
Source: Public Records
Tax History Compared to Growth
Tax History
| Year | Tax Paid | Tax Assessment Tax Assessment Total Assessment is a certain percentage of the fair market value that is determined by local assessors to be the total taxable value of land and additions on the property. | Land | Improvement |
|---|---|---|---|---|
| 2025 | $544 | $50,400 | $22,500 | $27,900 |
| 2024 | $5,229 | $50,400 | $22,500 | $27,900 |
| 2023 | $5,229 | $50,400 | $22,500 | $27,900 |
| 2022 | $5,162 | $50,400 | $22,500 | $27,900 |
| 2021 | $5,148 | $50,400 | $22,500 | $27,900 |
| 2020 | $5,146 | $50,400 | $22,500 | $27,900 |
| 2019 | $5,085 | $50,400 | $22,500 | $27,900 |
| 2018 | $5,013 | $50,400 | $22,500 | $27,900 |
| 2017 | $4,914 | $50,400 | $22,500 | $27,900 |
| 2016 | -- | $50,400 | $22,500 | $27,900 |
| 2015 | -- | $50,400 | $22,500 | $27,900 |
| 2014 | -- | $50,400 | $22,500 | $27,900 |
Source: Public Records
Map
Nearby Homes