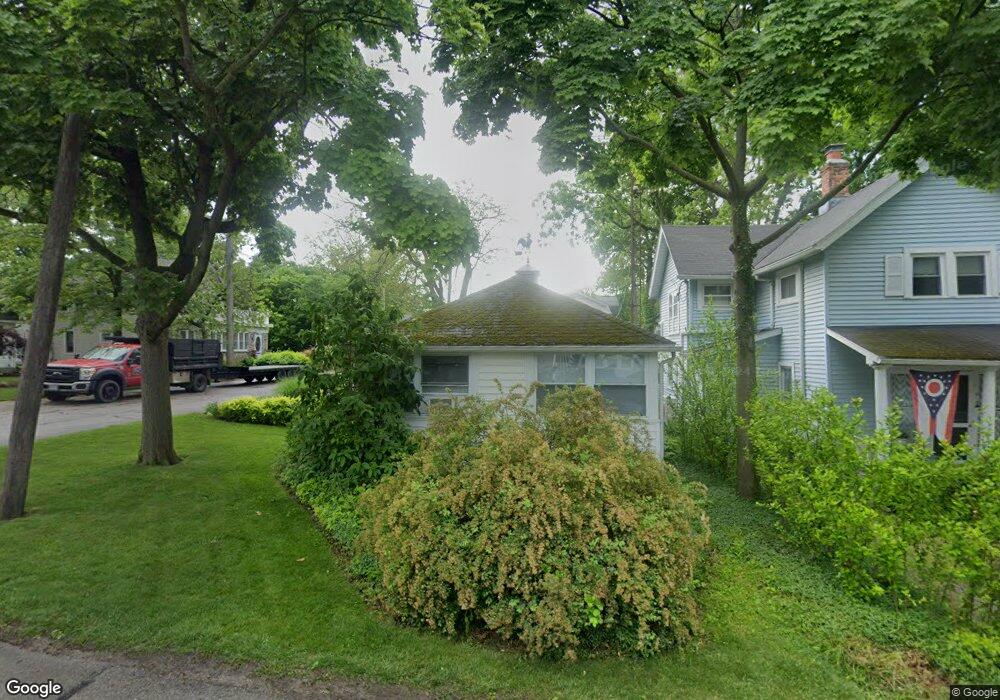
325 Laurel Ave Lakeside Marblehead, OH 43440
Estimated Value: $417,461 - $497,000
2
Beds
1
Bath
720
Sq Ft
$632/Sq Ft
Est. Value
About This Home
This home is located at 325 Laurel Ave, Lakeside Marblehead, OH 43440 and is currently estimated at $455,365, approximately $632 per square foot. 325 Laurel Ave is a home located in Ottawa County with nearby schools including Danbury Middle School and Danbury High School.
Ownership History
Date
Name
Owned For
Owner Type
Purchase Details
Closed on
Sep 28, 2013
Sold by
Richards George A and Bradsher Carol R
Bought by
Merrill Catherine Ann
Current Estimated Value
Home Financials for this Owner
Home Financials are based on the most recent Mortgage that was taken out on this home.
Original Mortgage
$148,000
Outstanding Balance
$107,296
Interest Rate
3.62%
Mortgage Type
Adjustable Rate Mortgage/ARM
Estimated Equity
$348,069
Purchase Details
Closed on
Sep 18, 1992
Sold by
Gasior Joan E
Bought by
Richards George A and Richards Pamela C
Create a Home Valuation Report for This Property
The Home Valuation Report is an in-depth analysis detailing your home's value as well as a comparison with similar homes in the area
Home Values in the Area
Average Home Value in this Area
Purchase History
| Date | Buyer | Sale Price | Title Company |
|---|---|---|---|
| Merrill Catherine Ann | $185,000 | Attorney | |
| Richards George A | $77,500 | -- |
Source: Public Records
Mortgage History
| Date | Status | Borrower | Loan Amount |
|---|---|---|---|
| Open | Merrill Catherine Ann | $148,000 |
Source: Public Records
Tax History Compared to Growth
Tax History
| Year | Tax Paid | Tax Assessment Tax Assessment Total Assessment is a certain percentage of the fair market value that is determined by local assessors to be the total taxable value of land and additions on the property. | Land | Improvement |
|---|---|---|---|---|
| 2024 | $4,334 | $127,155 | $92,092 | $35,063 |
| 2023 | $4,334 | $97,342 | $83,720 | $13,622 |
| 2022 | $3,361 | $97,342 | $83,720 | $13,622 |
| 2021 | $3,371 | $97,340 | $83,720 | $13,620 |
| 2020 | $2,812 | $76,850 | $64,400 | $12,450 |
| 2019 | $2,602 | $76,850 | $64,400 | $12,450 |
| 2018 | $2,759 | $76,850 | $64,400 | $12,450 |
| 2017 | $2,571 | $70,570 | $59,890 | $10,680 |
| 2016 | $2,547 | $70,570 | $59,890 | $10,680 |
| 2015 | $2,559 | $70,570 | $59,890 | $10,680 |
| 2014 | $2,196 | $63,010 | $35,110 | $27,900 |
| 2013 | $2,196 | $63,010 | $35,110 | $27,900 |
Source: Public Records
Map
Nearby Homes