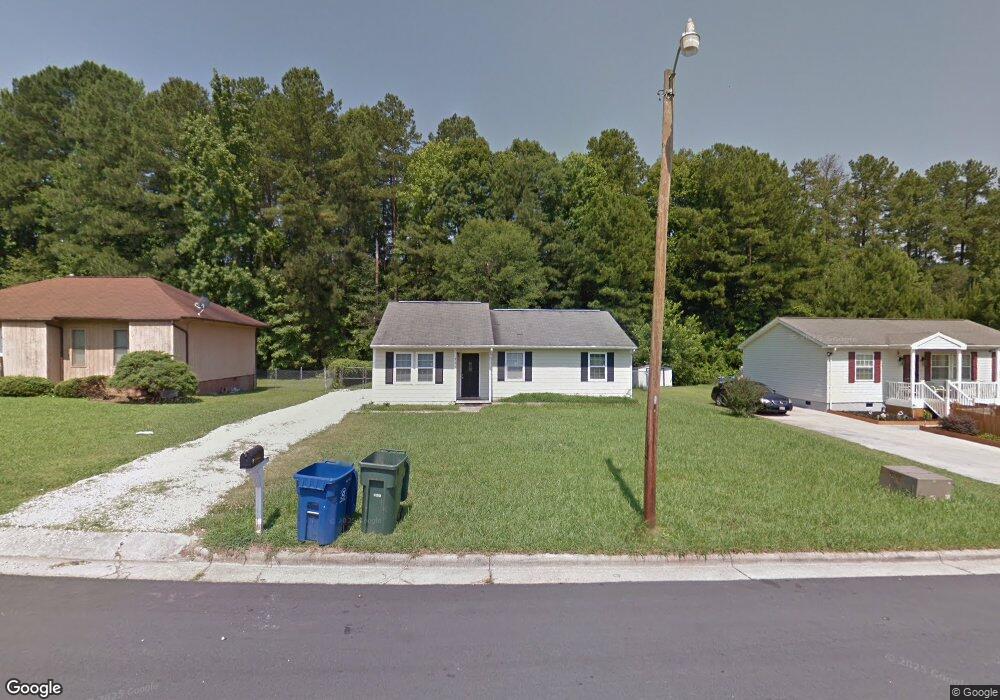
325 Melbourne St Durham, NC 27703
Eastern Durham NeighborhoodEstimated Value: $274,000 - $307,000
3
Beds
2
Baths
1,260
Sq Ft
$230/Sq Ft
Est. Value
About This Home
This home is located at 325 Melbourne St, Durham, NC 27703 and is currently estimated at $289,767, approximately $229 per square foot. 325 Melbourne St is a home located in Durham County with nearby schools including Merrick-Moore Elementary School, John W Neal Middle School, and Southern School of Energy & Sustainability.
Ownership History
Date
Name
Owned For
Owner Type
Purchase Details
Closed on
Jan 7, 2010
Sold by
Wells Fargo Bank N A
Bought by
Y & N Investment Group Llc
Current Estimated Value
Purchase Details
Closed on
Dec 7, 2009
Sold by
Myles Alberta and Unity Mortgage Inc
Bought by
Wells Fargo Bank Na
Purchase Details
Closed on
Jan 18, 2002
Sold by
Myles Conrade and Myles Nancy
Bought by
Myles Alberta
Home Financials for this Owner
Home Financials are based on the most recent Mortgage that was taken out on this home.
Original Mortgage
$85,850
Interest Rate
8.5%
Purchase Details
Closed on
Jul 2, 1998
Sold by
Upchurch Thomas C and Upchurch Margaret T
Bought by
Myles Conrade and Myles Nancy
Home Financials for this Owner
Home Financials are based on the most recent Mortgage that was taken out on this home.
Original Mortgage
$12,000
Interest Rate
7.1%
Mortgage Type
Seller Take Back
Create a Home Valuation Report for This Property
The Home Valuation Report is an in-depth analysis detailing your home's value as well as a comparison with similar homes in the area
Home Values in the Area
Average Home Value in this Area
Purchase History
| Date | Buyer | Sale Price | Title Company |
|---|---|---|---|
| Y & N Investment Group Llc | $25,000 | None Available | |
| Wells Fargo Bank Na | $79,050 | None Available | |
| Myles Alberta | $101,000 | -- | |
| Myles Conrade | $12,000 | -- |
Source: Public Records
Mortgage History
| Date | Status | Borrower | Loan Amount |
|---|---|---|---|
| Previous Owner | Myles Alberta | $85,850 | |
| Previous Owner | Myles Conrade | $12,000 |
Source: Public Records
Tax History Compared to Growth
Tax History
| Year | Tax Paid | Tax Assessment Tax Assessment Total Assessment is a certain percentage of the fair market value that is determined by local assessors to be the total taxable value of land and additions on the property. | Land | Improvement |
|---|---|---|---|---|
| 2025 | $2,472 | $249,377 | $81,250 | $168,127 |
| 2024 | $1,817 | $130,247 | $28,125 | $102,122 |
| 2023 | $1,706 | $130,247 | $28,125 | $102,122 |
| 2022 | $1,667 | $130,247 | $28,125 | $102,122 |
| 2021 | $1,659 | $130,247 | $28,125 | $102,122 |
| 2020 | $1,620 | $130,247 | $28,125 | $102,122 |
| 2019 | $1,620 | $130,247 | $28,125 | $102,122 |
| 2018 | $1,362 | $100,416 | $21,875 | $78,541 |
| 2017 | $1,352 | $100,416 | $21,875 | $78,541 |
| 2016 | $1,307 | $100,416 | $21,875 | $78,541 |
| 2015 | $1,667 | $120,400 | $21,817 | $98,583 |
| 2014 | $1,667 | $120,400 | $21,817 | $98,583 |
Source: Public Records
Map
Nearby Homes
- 2513 Rochelle St
- 2619 Mansfield Ave
- 2605 Holloway St
- 8 Elaine Cir
- 525 N Hoover Rd
- 2804 Lutz Ln
- 431 Princess Anne Dr
- 101 Seminole St
- 713 Heidelberg St
- 113 Herbert St
- 15 Red Sunset Ln
- 2125 Cheek Rd
- 3033 Fenimore St
- 118 Lynn Rd
- 1121 Raynor St
- 322+326 Chandler Rd
- Beramont Plan at Chandler Run
- Millhaven Plan at Chandler Run
- Merlot Plan at Chandler Run
- 1116 Delano St
- 321 Melbourne St
- 329 Melbourne St
- 317 Melbourne St
- 401 Melbourne St
- 315 Melbourne St
- 1 Beckham Place
- 2 Beckham Place
- 405 Melbourne St
- 322 Junction Rd
- 322 Junction Rd Unit 25a
- 3 Beckham Place
- 4 Beckham Place
- 316 Melbourne St
- 2 Knob Ct
- 409 Melbourne St
- 4 Knob Ct
- 5 Beckham Place
- 312 Melbourne St
- 6 Beckham Place
- 6 Knob Ct