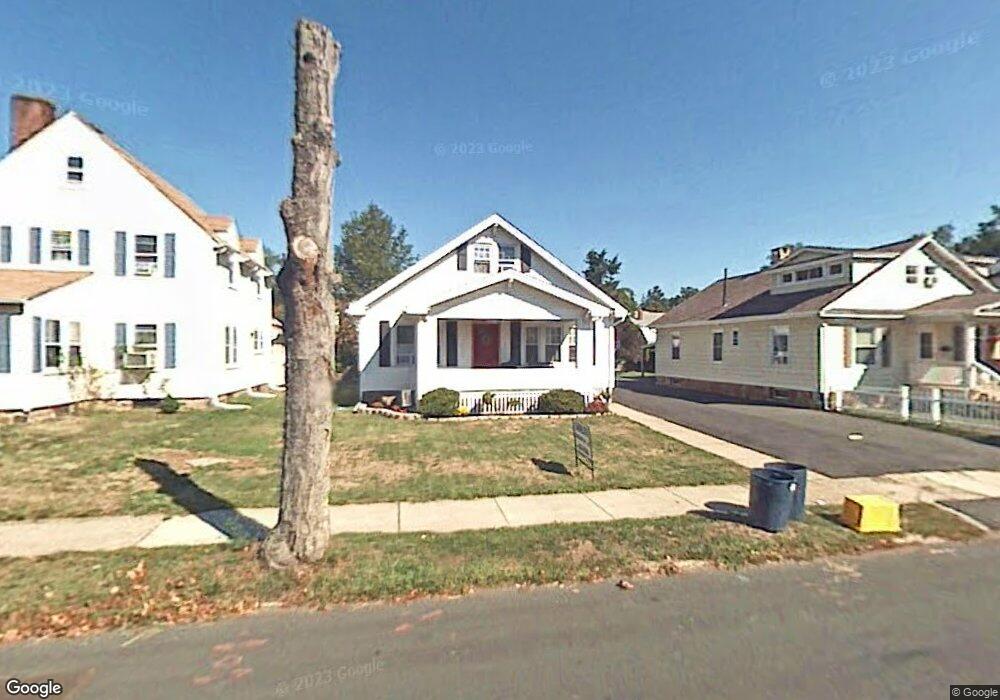
325 Monroe St New Britain, CT 06052
Estimated Value: $319,603 - $387,000
2
Beds
1
Bath
1,761
Sq Ft
$202/Sq Ft
Est. Value
About This Home
This home is located at 325 Monroe St, New Britain, CT 06052 and is currently estimated at $356,401, approximately $202 per square foot. 325 Monroe St is a home located in Hartford County with nearby schools including Vance School, Slade Middle School, and Raymond Hill School.
Ownership History
Date
Name
Owned For
Owner Type
Purchase Details
Closed on
Jul 18, 2011
Sold by
Department Of Housing & Urban Dev
Bought by
Torres Jennifer
Current Estimated Value
Home Financials for this Owner
Home Financials are based on the most recent Mortgage that was taken out on this home.
Original Mortgage
$9,676
Outstanding Balance
$6,679
Interest Rate
4.58%
Estimated Equity
$349,722
Purchase Details
Closed on
Oct 4, 2010
Sold by
Bac Home Loans Svcng L
Bought by
Department Of Housing & Urban Dev
Purchase Details
Closed on
Jul 19, 2010
Sold by
Brown David T
Bought by
Countrywide Home Loans
Purchase Details
Closed on
Feb 1, 1999
Sold by
Spear Don E
Bought by
Brown David T and Brown Michele M
Purchase Details
Closed on
Jul 22, 1991
Sold by
Sokolowski Steven and Sokolowski Debra
Bought by
Lennehan William J and Lennehan Lori A
Create a Home Valuation Report for This Property
The Home Valuation Report is an in-depth analysis detailing your home's value as well as a comparison with similar homes in the area
Home Values in the Area
Average Home Value in this Area
Purchase History
| Date | Buyer | Sale Price | Title Company |
|---|---|---|---|
| Torres Jennifer | $100,000 | -- | |
| Department Of Housing & Urban Dev | -- | -- | |
| Countrywide Home Loans | -- | -- | |
| Brown David T | $78,000 | -- | |
| Lennehan William J | $125,000 | -- |
Source: Public Records
Mortgage History
| Date | Status | Borrower | Loan Amount |
|---|---|---|---|
| Open | Lennehan William J | $9,676 | |
| Previous Owner | Lennehan William J | $175,493 |
Source: Public Records
Tax History Compared to Growth
Tax History
| Year | Tax Paid | Tax Assessment Tax Assessment Total Assessment is a certain percentage of the fair market value that is determined by local assessors to be the total taxable value of land and additions on the property. | Land | Improvement |
|---|---|---|---|---|
| 2025 | $5,622 | $143,500 | $44,240 | $99,260 |
| 2024 | $5,681 | $143,500 | $44,240 | $99,260 |
| 2023 | $5,493 | $143,500 | $44,240 | $99,260 |
| 2022 | $4,657 | $94,080 | $20,370 | $73,710 |
| 2021 | $4,657 | $94,080 | $20,370 | $73,710 |
| 2020 | $4,751 | $94,080 | $20,370 | $73,710 |
| 2019 | $4,751 | $94,080 | $20,370 | $73,710 |
| 2018 | $4,751 | $94,080 | $20,370 | $73,710 |
| 2017 | $4,694 | $92,960 | $18,690 | $74,270 |
| 2016 | $4,694 | $92,960 | $18,690 | $74,270 |
| 2015 | $4,555 | $92,960 | $18,690 | $74,270 |
| 2014 | $4,555 | $92,960 | $18,690 | $74,270 |
Source: Public Records
Map
Nearby Homes
- 256 Hart St
- 423 Monroe St
- 300 Lincoln St
- 73 Brooklawn St
- 212 Lincoln St
- 100 Shuttle Meadow Ave
- 93 Winthrop St
- 112 Lincoln St
- 30 Norden St
- 66 Lincoln St
- 17 Kensington Ave
- 70 Monroe St
- 45 Park Place Unit 205
- 96 Garden St
- 300 W Main St
- 239 Glen St Unit 2A
- 565 Lincoln St
- 14 Park Place Unit 4
- 78 Victoria Rd
- 235 W Main St