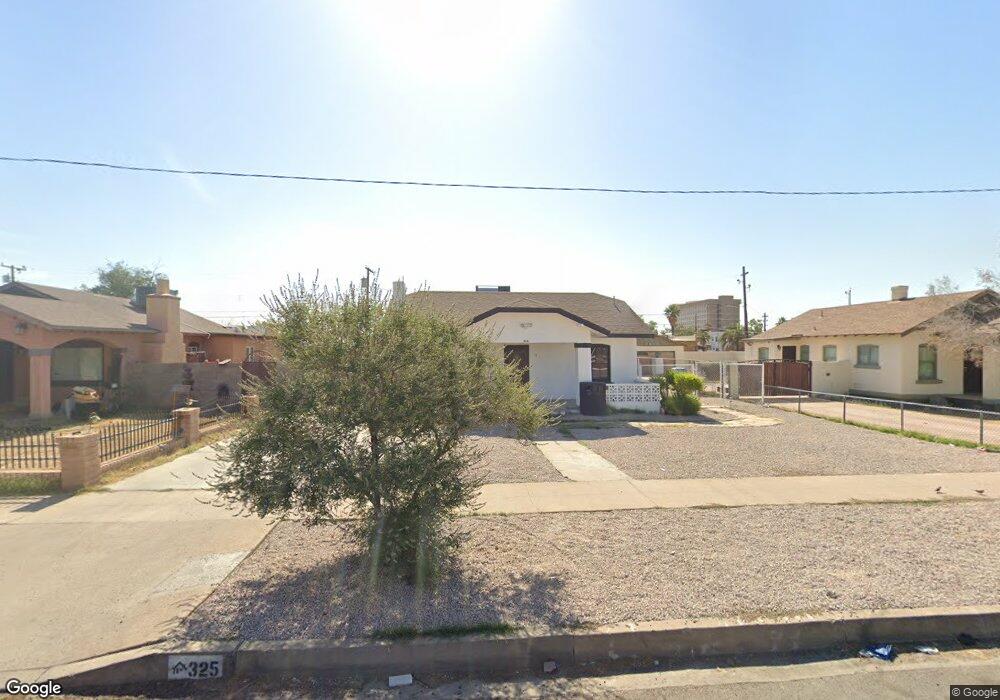
325 N 18th Dr Unit C Phoenix, AZ 85007
Governmental Mall NeighborhoodEstimated Value: $579,000 - $693,000
1
Bed
1
Bath
523
Sq Ft
$1,209/Sq Ft
Est. Value
About This Home
This home is located at 325 N 18th Dr Unit C, Phoenix, AZ 85007 and is currently estimated at $632,399, approximately $1,209 per square foot. 325 N 18th Dr Unit C is a home located in Maricopa County with nearby schools including Capitol Elementary School, Phoenix Coding Academy, and Central High School.
Ownership History
Date
Name
Owned For
Owner Type
Purchase Details
Closed on
Nov 5, 2024
Sold by
Orange Door Equity Llc
Bought by
Trusheim Leon Niklas and Trusheim Miriam Yamileth
Current Estimated Value
Home Financials for this Owner
Home Financials are based on the most recent Mortgage that was taken out on this home.
Original Mortgage
$669,647
Outstanding Balance
$662,981
Interest Rate
6.12%
Mortgage Type
FHA
Estimated Equity
-$30,582
Purchase Details
Closed on
Sep 4, 2024
Sold by
Ff Equity Llc
Bought by
Orange Door Equity Llc
Home Financials for this Owner
Home Financials are based on the most recent Mortgage that was taken out on this home.
Original Mortgage
$540,000
Interest Rate
6.78%
Mortgage Type
New Conventional
Purchase Details
Closed on
Jan 23, 2024
Sold by
Aurum 2 Llc
Bought by
Ff Equity Llc
Purchase Details
Closed on
Mar 14, 2019
Sold by
Ordonez Feliciano Herrera
Bought by
Ordonez Eddie C and Johnson Eloisa O
Purchase Details
Closed on
Jan 31, 2017
Sold by
Ordonez Feliciano H
Bought by
Ordonez Feliciano H and Ordonez Eddie C
Create a Home Valuation Report for This Property
The Home Valuation Report is an in-depth analysis detailing your home's value as well as a comparison with similar homes in the area
Home Values in the Area
Average Home Value in this Area
Purchase History
| Date | Buyer | Sale Price | Title Company |
|---|---|---|---|
| Trusheim Leon Niklas | $682,000 | Navi Title Agency | |
| Trusheim Leon Niklas | $682,000 | Navi Title Agency | |
| Orange Door Equity Llc | -- | Standard Title | |
| Ff Equity Llc | $365,000 | First American Title Insurance | |
| Aurum 2 Llc | $350,000 | American Title Service Agency | |
| Clear Horizon Properties Llc | $340,000 | American Title Service Agency | |
| Ordonez Eddie C | -- | None Available | |
| Ordonez Feliciano H | -- | None Available | |
| Ordonez Feliciano H | -- | None Available |
Source: Public Records
Mortgage History
| Date | Status | Borrower | Loan Amount |
|---|---|---|---|
| Open | Trusheim Leon Niklas | $669,647 | |
| Closed | Trusheim Leon Niklas | $669,647 | |
| Previous Owner | Orange Door Equity Llc | $540,000 |
Source: Public Records
Tax History Compared to Growth
Tax History
| Year | Tax Paid | Tax Assessment Tax Assessment Total Assessment is a certain percentage of the fair market value that is determined by local assessors to be the total taxable value of land and additions on the property. | Land | Improvement |
|---|---|---|---|---|
| 2025 | $1,654 | $12,370 | -- | -- |
| 2024 | $1,453 | $11,781 | -- | -- |
| 2023 | $1,453 | $30,620 | $6,120 | $24,500 |
| 2022 | $1,397 | $24,250 | $4,850 | $19,400 |
| 2021 | $1,398 | $21,160 | $4,230 | $16,930 |
| 2020 | $1,418 | $17,710 | $3,540 | $14,170 |
| 2019 | $1,418 | $12,820 | $2,560 | $10,260 |
| 2018 | $266 | $9,560 | $1,910 | $7,650 |
| 2017 | $256 | $6,720 | $1,340 | $5,380 |
| 2016 | -- | $5,810 | $1,160 | $4,650 |
| 2015 | -- | $5,450 | $1,090 | $4,360 |
Source: Public Records
Map
Nearby Homes
- 325 N 17th Dr
- 329 N 17th Dr
- 415 N 17th Dr
- 1945 W Van Buren St
- 1913 W Adams St
- 2002 W Adams St
- 1941 W Washington St Unit 9
- 2002 W Jefferson St
- 1522 W Fillmore St
- 1522 W Fillmore St Unit 6-7
- 2013 W Jefferson St
- 2006 W Madison St
- 1830 W Fillmore St Unit 3
- 1322 W Monroe St
- 1322 W Taylor St
- 1315 W Woodland Ave
- 1330 W Fillmore St
- 1711 W Latham St
- 2201 W Washington St
- 2215 W Washington St
- 325 N 18th Dr Unit A
- 329 N 18th Dr
- 329 N 18th Dr Unit all
- 321 N 18th Dr
- 333 N 18th Dr
- 366XX N 18th Dr Unit 1
- 326 N 18th Ave
- 324 N 18th Ave
- 330 N 18th Ave
- 328 N 18th Ave
- 337 N 18th Dr
- 318 N 18th Ave
- 334 N 18th Ave
- 326 N 18th Dr
- 330 N 18th Dr
- 322 N 18th Dr
- 334 N 18th Dr
- 340 N 18th Ave
- 318 N 18th Dr
- 365 N 19th Ave Unit 4