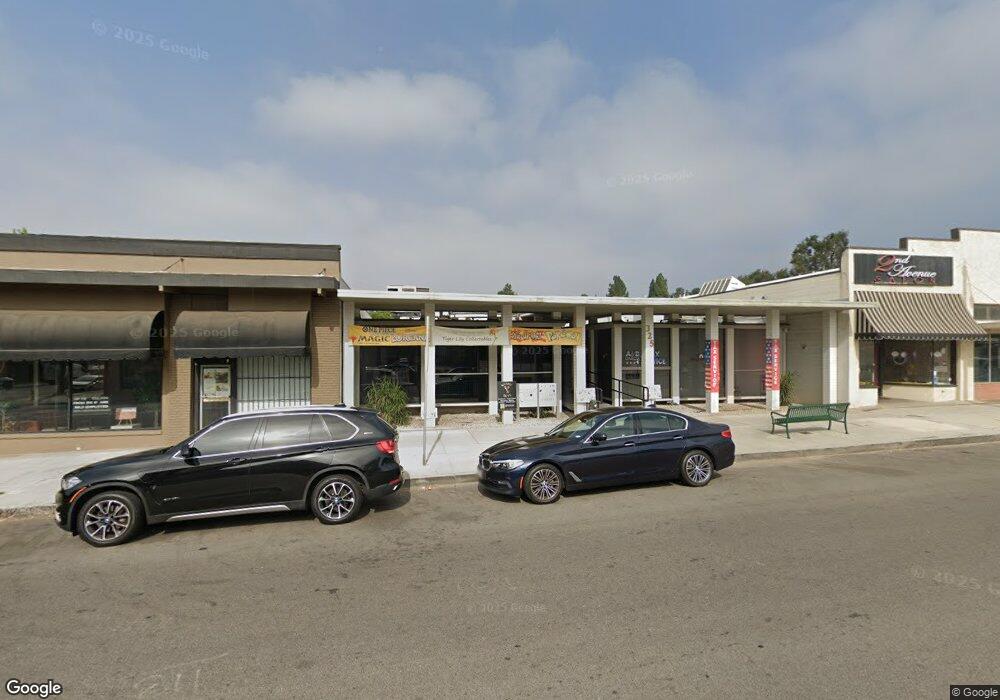
325 N 2nd Ave Upland, CA 91786
Estimated Value: $1,439,839
5
Beds
2
Baths
5,682
Sq Ft
$253/Sq Ft
Est. Value
About This Home
This home is located at 325 N 2nd Ave, Upland, CA 91786 and is currently estimated at $1,439,839, approximately $253 per square foot. 325 N 2nd Ave is a home located in San Bernardino County with nearby schools including Upland Elementary School, Upland Junior High School, and Upland High School.
Ownership History
Date
Name
Owned For
Owner Type
Purchase Details
Closed on
Oct 3, 2017
Sold by
Vahovick Charles W and Nancy A Jensen Revocable Trust
Bought by
Ginormous Jean Pants Family Lp
Current Estimated Value
Purchase Details
Closed on
Nov 5, 1996
Sold by
Hagberg Keith A & Olive I Trust and Olive I
Bought by
Jensen James and Jensen Nancy A
Home Financials for this Owner
Home Financials are based on the most recent Mortgage that was taken out on this home.
Original Mortgage
$148,000
Interest Rate
7.67%
Mortgage Type
Commercial
Purchase Details
Closed on
Aug 2, 1996
Sold by
Hagberg Olive I
Bought by
Hagberg Olive I and Keith A & Olive I Hagberg 1983
Purchase Details
Closed on
Mar 14, 1995
Sold by
Equity Transfer Corp Inc
Bought by
Hagberg Keith A and Hagberg Olive I
Create a Home Valuation Report for This Property
The Home Valuation Report is an in-depth analysis detailing your home's value as well as a comparison with similar homes in the area
Home Values in the Area
Average Home Value in this Area
Purchase History
| Date | Buyer | Sale Price | Title Company |
|---|---|---|---|
| Ginormous Jean Pants Family Lp | $880,000 | Chicago Title Company | |
| Jensen James | $150,000 | North American Title Co | |
| Hagberg Olive I | -- | -- | |
| Hagberg Keith A | $443,595 | First American Title Ins Co |
Source: Public Records
Mortgage History
| Date | Status | Borrower | Loan Amount |
|---|---|---|---|
| Previous Owner | Jensen James | $148,000 |
Source: Public Records
Tax History
| Year | Tax Paid | Tax Assessment Tax Assessment Total Assessment is a certain percentage of the fair market value that is determined by local assessors to be the total taxable value of land and additions on the property. | Land | Improvement |
|---|---|---|---|---|
| 2025 | $10,958 | $1,001,291 | $284,458 | $716,833 |
| 2024 | $10,610 | $981,657 | $278,880 | $702,777 |
| 2023 | $10,453 | $962,409 | $273,412 | $688,997 |
| 2022 | $10,230 | $943,538 | $268,051 | $675,487 |
| 2021 | $10,223 | $925,037 | $262,795 | $662,242 |
| 2020 | $9,946 | $915,552 | $260,100 | $655,452 |
| 2019 | $9,912 | $897,600 | $255,000 | $642,600 |
| 2018 | $9,667 | $880,000 | $250,000 | $630,000 |
| 2017 | $2,426 | $210,492 | $87,005 | $123,487 |
| 2016 | $2,238 | $206,365 | $85,299 | $121,066 |
| 2015 | $2,187 | $203,265 | $84,018 | $119,247 |
| 2014 | $2,131 | $199,283 | $82,372 | $116,911 |
Source: Public Records
Map
Nearby Homes
Your Personal Tour Guide
Ask me questions while you tour the home.