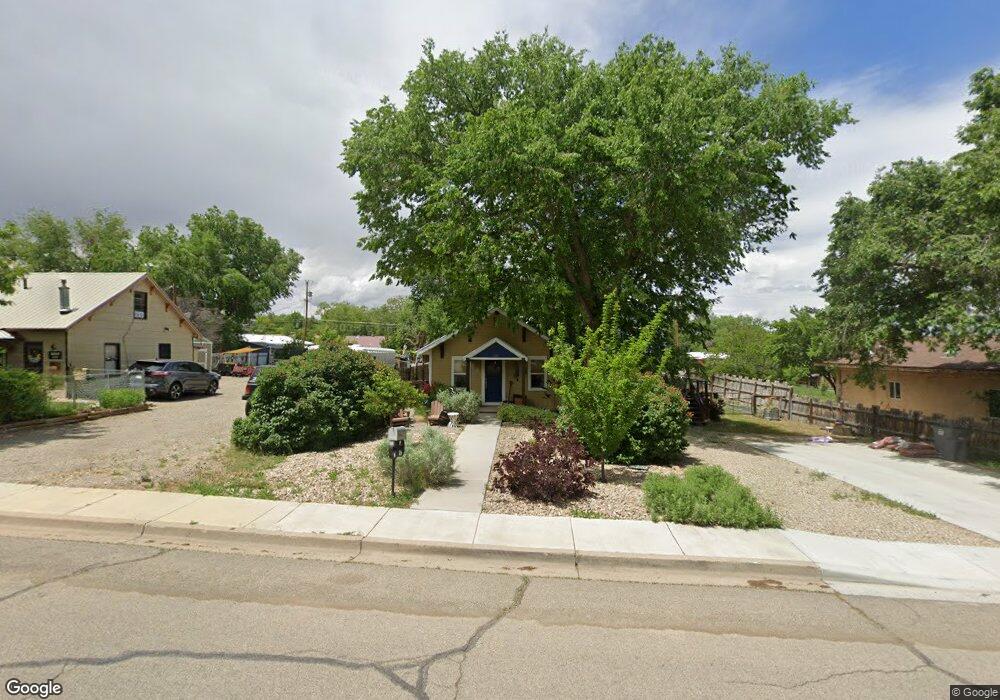
325 N Ash St Cortez, CO 81321
Estimated Value: $188,061 - $235,000
2
Beds
1
Bath
680
Sq Ft
$315/Sq Ft
Est. Value
About This Home
This home is located at 325 N Ash St, Cortez, CO 81321 and is currently estimated at $214,265, approximately $315 per square foot. 325 N Ash St is a home located in Montezuma County with nearby schools including Montezuma-Cortez High School, Children's Kiva Montessori School, and Children's Kiva Montessori Preschool & Kindergarten.
Ownership History
Date
Name
Owned For
Owner Type
Purchase Details
Closed on
Dec 12, 2017
Sold by
Feit Richard Micxhael
Bought by
Barry Charlotte L
Current Estimated Value
Home Financials for this Owner
Home Financials are based on the most recent Mortgage that was taken out on this home.
Original Mortgage
$460,000
Outstanding Balance
$387,280
Interest Rate
3.94%
Mortgage Type
New Conventional
Estimated Equity
-$173,015
Purchase Details
Closed on
Jun 1, 2012
Sold by
Felt Leonard M
Bought by
Felt Richard M
Purchase Details
Closed on
Jun 9, 2011
Sold by
Moore Earl A and Barkdull Meredith
Bought by
Feit Richard Michael and Feit Leonard Marvin
Home Financials for this Owner
Home Financials are based on the most recent Mortgage that was taken out on this home.
Original Mortgage
$62,400
Interest Rate
4.74%
Mortgage Type
Unknown
Create a Home Valuation Report for This Property
The Home Valuation Report is an in-depth analysis detailing your home's value as well as a comparison with similar homes in the area
Home Values in the Area
Average Home Value in this Area
Purchase History
| Date | Buyer | Sale Price | Title Company |
|---|---|---|---|
| Barry Charlotte L | -- | None Available | |
| Felt Richard M | -- | None Available | |
| Feit Richard Michael | $78,000 | Colorado Land Title Co |
Source: Public Records
Mortgage History
| Date | Status | Borrower | Loan Amount |
|---|---|---|---|
| Open | Barry Charlotte L | $460,000 | |
| Previous Owner | Feit Richard Michael | $62,400 |
Source: Public Records
Tax History Compared to Growth
Tax History
| Year | Tax Paid | Tax Assessment Tax Assessment Total Assessment is a certain percentage of the fair market value that is determined by local assessors to be the total taxable value of land and additions on the property. | Land | Improvement |
|---|---|---|---|---|
| 2024 | $462 | $8,999 | $2,498 | $6,501 |
| 2023 | $462 | $13,377 | $3,713 | $9,664 |
| 2022 | $420 | $8,676 | $1,695 | $6,981 |
| 2021 | $427 | $8,676 | $1,695 | $6,981 |
| 2020 | $374 | $7,891 | $1,865 | $6,026 |
| 2019 | $375 | $7,891 | $1,865 | $6,026 |
| 2018 | $428 | $6,710 | $1,690 | $5,020 |
| 2017 | $426 | $6,710 | $1,690 | $5,020 |
| 2016 | $388 | $6,760 | $1,870 | $4,890 |
| 2015 | $356 | $98,430 | $0 | $0 |
| 2014 | $415 | $6,760 | $0 | $0 |
Source: Public Records
Map
Nearby Homes
- 416 N Ash St
- 323 N Washington St
- 102 E Montezuma Ave
- 521 N Beech St
- 243 N Madison St
- 23 E Montezuma Ave
- 125 N Madison St
- 235 N Chestnut St Unit 6
- 625 N Harrison St
- 240 N Elm St
- 532 E Arbecam Ave
- 210 W Coronado Ave
- 537 N Elm St
- 506 Amanda Lee Ln
- 122 E 1st St Unit see broker remarks
- 112 N Adams St
- TBD E Empire St
- 409 N Broadway
- 145 S Madison St
- 201 S Washington St