
Seller's Agent in 2021
Maria Skipper
Bella Grande Properties
(503) 351-4101
1 in this area
29 Total Sales
Estimated Value: $354,000 - $414,000
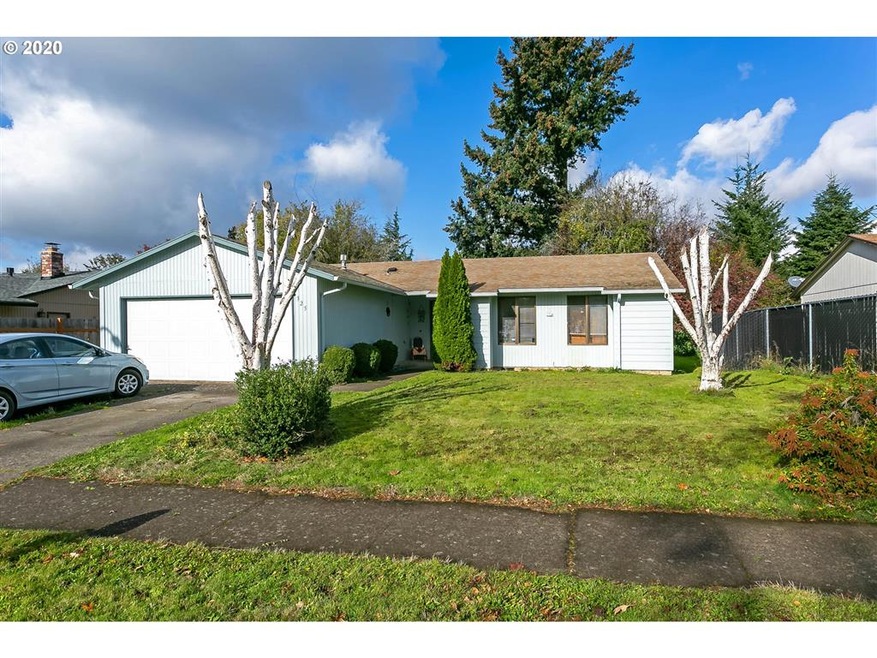
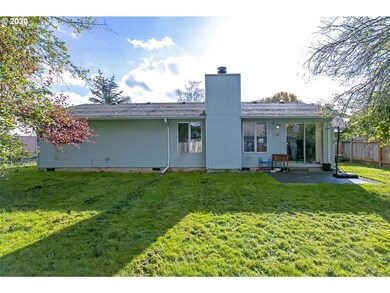
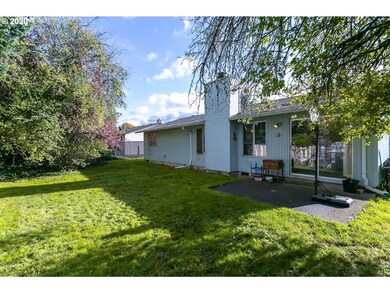
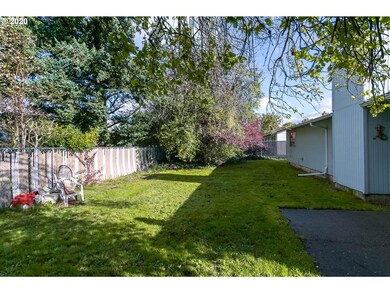
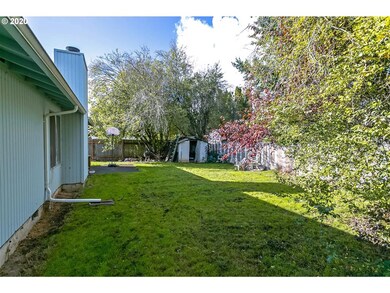
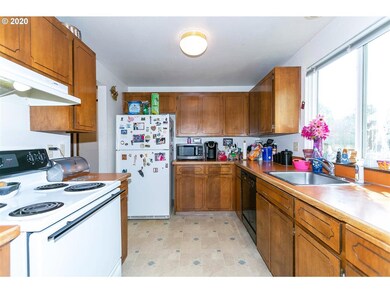
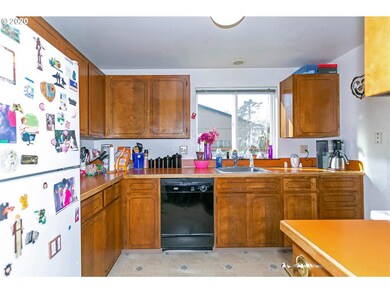
Charming one level home situated on an oversized 6,970 SQFT lot! Great backyard! Cosmetic fixer. Home features a spacious master bedroom with an ensuite full-bathroom and walk-in closet. Very convenient location; Walk score is 74 = very walkable. Do not disturb tenants; showings by appointment only please.
Last Agent to Sell the Property
Bella Grande Properties License #200303228 Listed on: 11/17/2020
| Date | Buyer | Sale Price | Title Company |
|---|---|---|---|
| Blow Alan A | $327,500 | Fidelity National Title Of O |
| Date | Status | Borrower | Loan Amount |
|---|---|---|---|
| Open | Blow Alan A | $311,125 |
| Date | Event | Price | List to Sale | Price per Sq Ft |
|---|---|---|---|---|
| 05/11/2021 05/11/21 | Sold | $327,500 | 0.0% | $277 / Sq Ft |
| 12/25/2020 12/25/20 | Pending | -- | -- | -- |
| 11/17/2020 11/17/20 | For Sale | $327,500 | 0.0% | $277 / Sq Ft |
| 11/17/2020 11/17/20 | Off Market | $327,500 | -- | -- |
| Year | Tax Paid | Tax Assessment Tax Assessment Total Assessment is a certain percentage of the fair market value that is determined by local assessors to be the total taxable value of land and additions on the property. | Land | Improvement |
|---|---|---|---|---|
| 2025 | $4,049 | $198,950 | -- | -- |
| 2024 | $3,876 | $193,160 | -- | -- |
| 2023 | $3,531 | $187,540 | $0 | $0 |
| 2022 | $3,432 | $182,080 | $0 | $0 |
| 2021 | $3,346 | $176,780 | $0 | $0 |
| 2020 | $3,148 | $171,640 | $0 | $0 |
| 2019 | $3,066 | $166,650 | $0 | $0 |
| 2018 | $2,923 | $161,800 | $0 | $0 |
| 2017 | $2,805 | $157,090 | $0 | $0 |
| 2016 | $2,473 | $152,520 | $0 | $0 |
Seller's Agent in 2021
Maria Skipper
Bella Grande Properties
(503) 351-4101
1 in this area
29 Total Sales
Buyer's Agent in 2021
Brendon Sewell
John L. Scott Market Center
(503) 347-6914
1 in this area
65 Total Sales
Source: Regional Multiple Listing Service (RMLS)
MLS Number: 20383763
APN: R313621
Disclaimer: Certain information contained herein is derived from information provided by parties other than Homes.com. All information provided is deemed reliable, but is not guaranteed to be accurate and should be independently verified.
![]() The content relating to real estate for sale on this web site comes in part from the IDX program of the RMLS™ of Portland, Oregon. Real estate listings held by brokerage firms other than Ten-X are marked with the RMLS™ logo, and detailed information about these properties includes the names of the listing brokers. Listing content is copyright © 2026 RMLS™, Portland, Oregon. Some properties which appear for sale on this web site may subsequently have sold or may no longer be available. All information provided is deemed reliable but is not guaranteed and should be independently verified.
The content relating to real estate for sale on this web site comes in part from the IDX program of the RMLS™ of Portland, Oregon. Real estate listings held by brokerage firms other than Ten-X are marked with the RMLS™ logo, and detailed information about these properties includes the names of the listing brokers. Listing content is copyright © 2026 RMLS™, Portland, Oregon. Some properties which appear for sale on this web site may subsequently have sold or may no longer be available. All information provided is deemed reliable but is not guaranteed and should be independently verified.
Ask me questions while you tour the home.