


325 NE Orchard St Port Saint Lucie, FL 34983
Northport Village Neighborhood
3
Beds
2
Baths
1,166
Sq Ft
9,148
Sq Ft Lot
Highlights
- Porch
- Separate Shower in Primary Bathroom
- Laundry Room
- Eat-In Kitchen
- Open Patio
- Awning
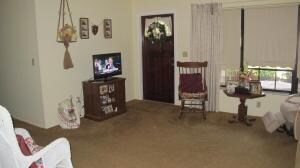
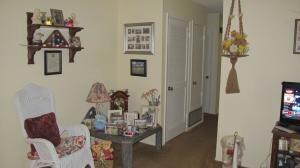
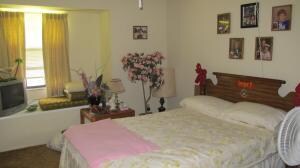
About This Home
As of August 2014Cozy 3 bedroom 2 bath with carport. Nice sized bedrooms and Laundry room. Front porch and back open patio. Fenced backyard and hurricane shutters. New roof in 2004. Plenty of room for a shed. Terrazzo under carpet. Room sizes approximate. Sold ''AS IS''.
Last Agent to Sell the Property
RE/MAX of Stuart License #BK654857 Listed on: 06/24/2014
Home Details
Home Type
- Single Family
Est. Annual Taxes
- $447
Year Built
- Built in 1973
Parking
- 1 Carport Space
Home Design
- Shingle Roof
- Composition Roof
Interior Spaces
- 1,166 Sq Ft Home
- 1-Story Property
- Ceiling Fan
- Awning
- Carpet
Kitchen
- Eat-In Kitchen
- Electric Range
Bedrooms and Bathrooms
- 3 Bedrooms
- Stacked Bedrooms
- 2 Full Bathrooms
- Separate Shower in Primary Bathroom
Laundry
- Laundry Room
- Dryer
- Washer
Outdoor Features
- Open Patio
- Porch
Additional Features
- 9,148 Sq Ft Lot
- Central Heating and Cooling System
Community Details
- Port St Lucie Floresta Pi Subdivision
Listing and Financial Details
- Assessor Parcel Number 342170200660007
Ownership History
Date
Name
Owned For
Owner Type
Purchase Details
Listed on
Jun 24, 2014
Closed on
Sep 26, 2014
Sold by
Sanchez Jose A and Sanchez Carmela
Bought by
Joenicks Corp
Seller's Agent
Marge Milam
RE/MAX of Stuart
Buyer's Agent
Marianne Ruland
LYNQ Real Estate
List Price
$79,900
Sold Price
$79,900
Home Financials for this Owner
Home Financials are based on the most recent Mortgage that was taken out on this home.
Avg. Annual Appreciation
13.76%
Purchase Details
Listed on
Jun 24, 2014
Closed on
Aug 5, 2014
Sold by
Soloway Regina
Bought by
Sanchez Jose A and Sanchez Carmela
Seller's Agent
Marge Milam
RE/MAX of Stuart
Buyer's Agent
Marianne Ruland
LYNQ Real Estate
List Price
$79,900
Sold Price
$79,900
Similar Home in Port Saint Lucie, FL
Create a Home Valuation Report for This Property
The Home Valuation Report is an in-depth analysis detailing your home's value as well as a comparison with similar homes in the area
Home Values in the Area
Average Home Value in this Area
Purchase History
| Date | Type | Sale Price | Title Company |
|---|---|---|---|
| Quit Claim Deed | -- | Attorney | |
| Warranty Deed | $79,900 | First International Title |
Source: Public Records
Property History
| Date | Event | Price | Change | Sq Ft Price |
|---|---|---|---|---|
| 06/21/2025 06/21/25 | For Sale | $327,500 | 0.0% | $252 / Sq Ft |
| 05/29/2025 05/29/25 | Off Market | $327,500 | -- | -- |
| 04/24/2025 04/24/25 | Price Changed | $327,500 | -2.8% | $252 / Sq Ft |
| 04/21/2025 04/21/25 | For Sale | $337,000 | 0.0% | $260 / Sq Ft |
| 11/20/2024 11/20/24 | Rented | $2,100 | 0.0% | -- |
| 11/14/2024 11/14/24 | Price Changed | $2,100 | -4.5% | $2 / Sq Ft |
| 11/06/2024 11/06/24 | For Rent | $2,200 | 0.0% | -- |
| 10/28/2024 10/28/24 | Off Market | $2,200 | -- | -- |
| 10/15/2024 10/15/24 | For Rent | $2,200 | +4.8% | -- |
| 11/05/2022 11/05/22 | Rented | $2,100 | 0.0% | -- |
| 10/20/2022 10/20/22 | Under Contract | -- | -- | -- |
| 10/05/2022 10/05/22 | For Rent | $2,100 | +52.7% | -- |
| 12/20/2019 12/20/19 | Rented | $1,375 | 0.0% | -- |
| 11/20/2019 11/20/19 | Under Contract | -- | -- | -- |
| 11/07/2019 11/07/19 | For Rent | $1,375 | +3.8% | -- |
| 08/20/2018 08/20/18 | Rented | $1,325 | 0.0% | -- |
| 07/21/2018 07/21/18 | Under Contract | -- | -- | -- |
| 07/16/2018 07/16/18 | For Rent | $1,325 | 0.0% | -- |
| 08/17/2016 08/17/16 | For Rent | $1,325 | +3.9% | -- |
| 08/17/2016 08/17/16 | Rented | $1,275 | 0.0% | -- |
| 08/05/2014 08/05/14 | Sold | $79,900 | 0.0% | $69 / Sq Ft |
| 07/06/2014 07/06/14 | Pending | -- | -- | -- |
| 06/24/2014 06/24/14 | For Sale | $79,900 | -- | $69 / Sq Ft |
Source: BeachesMLS
Tax History Compared to Growth
Tax History
| Year | Tax Paid | Tax Assessment Tax Assessment Total Assessment is a certain percentage of the fair market value that is determined by local assessors to be the total taxable value of land and additions on the property. | Land | Improvement |
|---|---|---|---|---|
| 2024 | $3,951 | $220,300 | $129,100 | $91,200 |
| 2023 | $3,951 | $210,700 | $115,700 | $95,000 |
| 2022 | $3,543 | $179,600 | $96,400 | $83,200 |
| 2021 | $3,095 | $132,700 | $57,800 | $74,900 |
| 2020 | $2,905 | $119,000 | $45,700 | $73,300 |
| 2019 | $2,801 | $118,500 | $42,900 | $75,600 |
| 2018 | $2,478 | $102,900 | $34,100 | $68,800 |
| 2017 | $2,261 | $83,200 | $26,600 | $56,600 |
| 2016 | $2,081 | $71,200 | $21,200 | $50,000 |
| 2015 | $1,899 | $56,100 | $13,700 | $42,400 |
| 2014 | $447 | $44,457 | $0 | $0 |
Source: Public Records
Agents Affiliated with this Home
-
Marianne Ruland
M
Seller's Agent in 2025
Marianne Ruland
LYNQ Real Estate
(772) 285-2875
1 in this area
14 Total Sales
-
Melissa Scionti
M
Buyer's Agent in 2024
Melissa Scionti
Pinnacle Real Estate Group
(772) 777-8500
2 in this area
51 Total Sales
-
Karen L.
K
Buyer's Agent in 2016
Karen L.
RE/MAX
(772) 812-5427
2 in this area
66 Total Sales
-
Marge Milam
Seller's Agent in 2014
Marge Milam
RE/MAX
(772) 216-5718
23 Total Sales
Map
Source: BeachesMLS
MLS Number: R10051825
APN: 34-21-702-0066-0007
Disclaimer: Certain information contained herein is derived from information provided by parties other than Homes.com. All information provided is deemed reliable, but is not guaranteed to be accurate and should be independently verified.
![]() IDX information is provided exclusively for personal, non-commercial use, and may not be used for any purpose other than to identify prospective properties consumers may be interested in purchasing. Information is deemed reliable but not guaranteed.
IDX information is provided exclusively for personal, non-commercial use, and may not be used for any purpose other than to identify prospective properties consumers may be interested in purchasing. Information is deemed reliable but not guaranteed.
Nearby Homes
- 323 NE Midfield Ln
- 333 NE Surrey St
- 262 NE Floresta Dr
- 342 NE Surrey St
- 234 NE Surrey St
- 309 NE Jonquil St
- 521 NE Solida Cir
- 121 NE Naranja Ave
- 201 NE Solida Cir
- 117 NE Naranja Ave
- 372 NE Ardsley Dr
- 131 NE Naranja Ave
- 340 NE Solida Dr
- 115 NE Caprona Ave
- 420 NE Cornwall Ave
- 401 NE Cornwall Ave
- 148 NE Estia Ln
- 417 NE Cornwall Ave
- 112 NE Caprona Ave
- 412 NE Midvale St