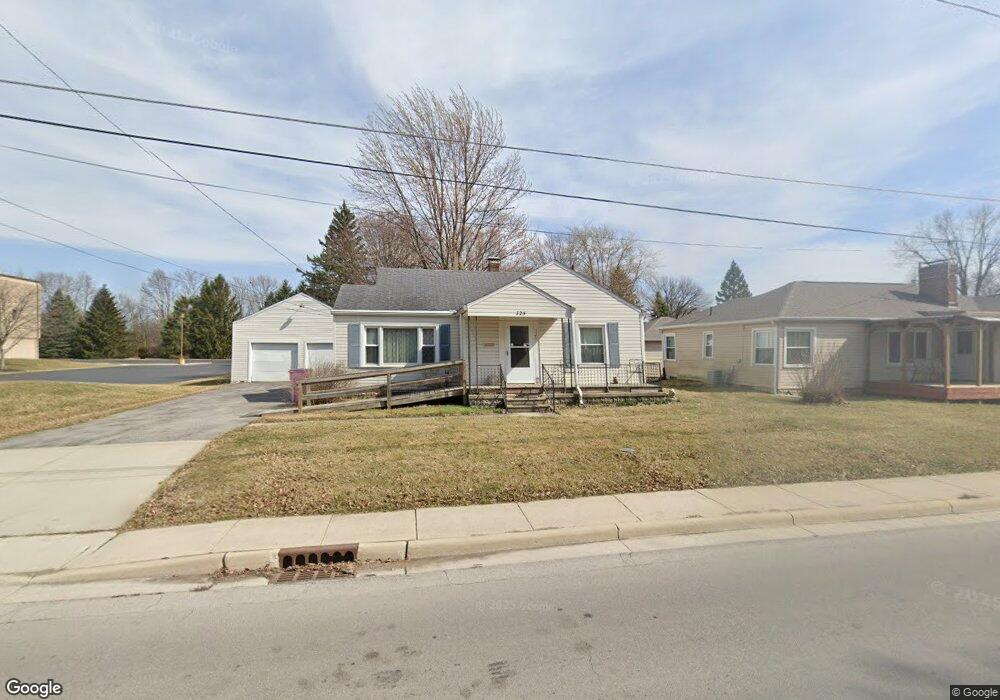
325 Osborn Ave Findlay, OH 45840
Estimated Value: $139,000 - $176,000
2
Beds
1
Bath
1,374
Sq Ft
$114/Sq Ft
Est. Value
About This Home
This home is located at 325 Osborn Ave, Findlay, OH 45840 and is currently estimated at $156,018, approximately $113 per square foot. 325 Osborn Ave is a home located in Hancock County with nearby schools including Wilson Vance Elementary School, Whittier Elementary School, and Donnell Middle School.
Ownership History
Date
Name
Owned For
Owner Type
Purchase Details
Closed on
Jun 19, 2012
Sold by
Fullington Janice and Maas Kathleen
Bought by
Chaplik Penny Lee and Chaplik Pennylee
Current Estimated Value
Home Financials for this Owner
Home Financials are based on the most recent Mortgage that was taken out on this home.
Original Mortgage
$42,565
Outstanding Balance
$29,499
Interest Rate
3.83%
Mortgage Type
New Conventional
Estimated Equity
$126,519
Purchase Details
Closed on
Apr 26, 2012
Sold by
Estate Of Eunice E West
Bought by
Fullington Janice and Maas Kathleen
Home Financials for this Owner
Home Financials are based on the most recent Mortgage that was taken out on this home.
Original Mortgage
$42,565
Outstanding Balance
$29,499
Interest Rate
3.83%
Mortgage Type
New Conventional
Estimated Equity
$126,519
Purchase Details
Closed on
Mar 1, 1996
Sold by
Beckett Patti
Bought by
West Eunice
Purchase Details
Closed on
Jun 28, 1991
Bought by
Beckett Patti Sue
Purchase Details
Closed on
Jan 24, 1990
Bought by
Bronson Mavis M
Create a Home Valuation Report for This Property
The Home Valuation Report is an in-depth analysis detailing your home's value as well as a comparison with similar homes in the area
Home Values in the Area
Average Home Value in this Area
Purchase History
| Date | Buyer | Sale Price | Title Company |
|---|---|---|---|
| Chaplik Penny Lee | $40,000 | Attorney | |
| Fullington Janice | -- | None Available | |
| West Eunice | $76,000 | -- | |
| Beckett Patti Sue | $66,500 | -- | |
| Bronson Mavis M | -- | -- |
Source: Public Records
Mortgage History
| Date | Status | Borrower | Loan Amount |
|---|---|---|---|
| Open | Chaplik Penny Lee | $42,565 |
Source: Public Records
Tax History
| Year | Tax Paid | Tax Assessment Tax Assessment Total Assessment is a certain percentage of the fair market value that is determined by local assessors to be the total taxable value of land and additions on the property. | Land | Improvement |
|---|---|---|---|---|
| 2024 | $978 | $37,340 | $4,390 | $32,950 |
| 2023 | $1,002 | $37,340 | $4,390 | $32,950 |
| 2022 | $1,014 | $37,340 | $4,390 | $32,950 |
| 2021 | $910 | $31,070 | $4,400 | $26,670 |
| 2020 | $908 | $31,070 | $4,400 | $26,670 |
| 2019 | $890 | $31,070 | $4,400 | $26,670 |
| 2018 | $799 | $27,130 | $3,820 | $23,310 |
| 2017 | $799 | $27,130 | $3,820 | $23,310 |
| 2016 | $801 | $27,130 | $3,820 | $23,310 |
| 2015 | $861 | $28,430 | $4,580 | $23,850 |
| 2014 | $861 | $28,430 | $4,580 | $23,850 |
| 2012 | $718 | $24,990 | $3,260 | $21,730 |
Source: Public Records
Map
Nearby Homes
- 309 Huron Rd
- 623 E Sandusky St
- 15591 Canadian Way
- 15586 Canadian Way
- 15615 Canadian Way
- 655 Clinton Ct
- 1421 E Sandusky St
- 640 Center St
- 1421 Autumn Dr
- 1020 Country Club Dr
- 523 Center St
- 1037 Fishlock Ave
- 439 Carnahan Ave
- 810 Mcconnell St
- 1308 Greendale Ave
- 829 Maple Ave
- 1100 Stall Dr
- 741 Central Ave
- 1125 Glen Meadow Dr
- 0 Blanchard Ave
Your Personal Tour Guide
Ask me questions while you tour the home.