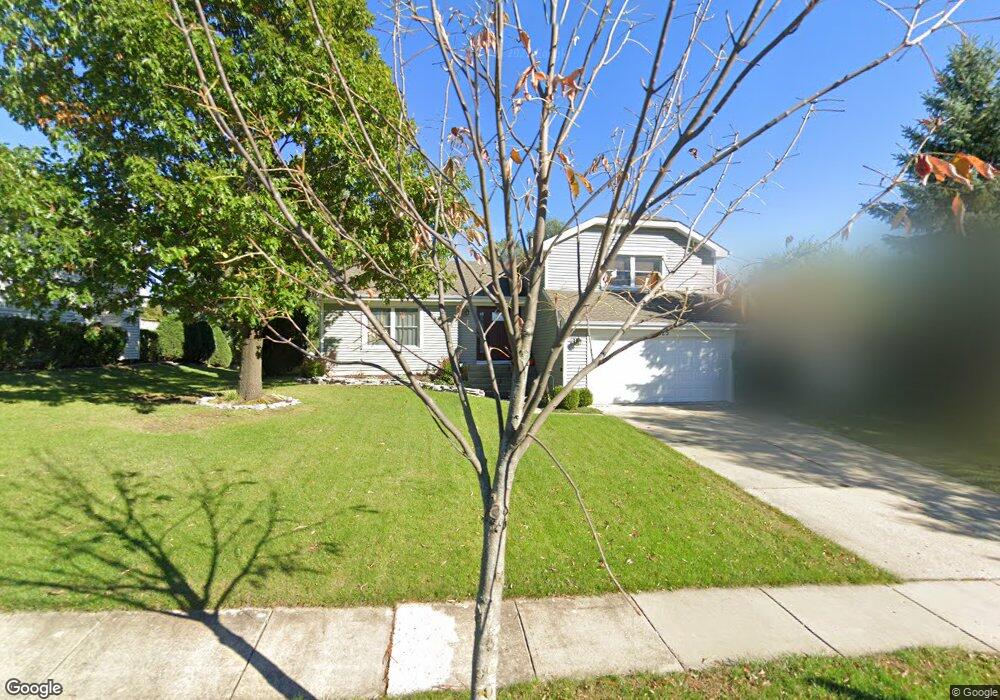
325 Partridge Ct Algonquin, IL 60102
High Hill Farms NeighborhoodEstimated Value: $371,000 - $396,000
3
Beds
3
Baths
1,420
Sq Ft
$268/Sq Ft
Est. Value
About This Home
This home is located at 325 Partridge Ct, Algonquin, IL 60102 and is currently estimated at $380,270, approximately $267 per square foot. 325 Partridge Ct is a home located in McHenry County with nearby schools including Westfield Community School, Kenneth E Neubert Elementary School, and United Junior High School.
Ownership History
Date
Name
Owned For
Owner Type
Purchase Details
Closed on
May 8, 2008
Sold by
Connor Dixie J and Jirak Dixie
Bought by
Jirak Dixie and Jirak Steven
Current Estimated Value
Home Financials for this Owner
Home Financials are based on the most recent Mortgage that was taken out on this home.
Original Mortgage
$183,000
Interest Rate
5.93%
Mortgage Type
New Conventional
Purchase Details
Closed on
Aug 29, 2003
Sold by
Morones Jim R and Morones Julie A
Bought by
Connor Dixie J
Home Financials for this Owner
Home Financials are based on the most recent Mortgage that was taken out on this home.
Original Mortgage
$190,800
Interest Rate
4.5%
Mortgage Type
Unknown
Purchase Details
Closed on
Jul 17, 1997
Sold by
Kristoff James E
Bought by
Morones Jim R and Morones Julie A
Home Financials for this Owner
Home Financials are based on the most recent Mortgage that was taken out on this home.
Original Mortgage
$121,600
Interest Rate
7.94%
Create a Home Valuation Report for This Property
The Home Valuation Report is an in-depth analysis detailing your home's value as well as a comparison with similar homes in the area
Home Values in the Area
Average Home Value in this Area
Purchase History
| Date | Buyer | Sale Price | Title Company |
|---|---|---|---|
| Jirak Dixie | -- | Chicago Title | |
| Connor Dixie J | $212,000 | Heritage Title Company | |
| Morones Jim R | $152,000 | -- |
Source: Public Records
Mortgage History
| Date | Status | Borrower | Loan Amount |
|---|---|---|---|
| Closed | Jirak Dixie | $183,000 | |
| Closed | Connor Dixie J | $190,800 | |
| Previous Owner | Morones Jim R | $121,600 |
Source: Public Records
Tax History Compared to Growth
Tax History
| Year | Tax Paid | Tax Assessment Tax Assessment Total Assessment is a certain percentage of the fair market value that is determined by local assessors to be the total taxable value of land and additions on the property. | Land | Improvement |
|---|---|---|---|---|
| 2024 | $7,599 | $105,138 | $21,800 | $83,338 |
| 2023 | $7,202 | $94,032 | $19,497 | $74,535 |
| 2022 | $6,504 | $81,846 | $21,044 | $60,802 |
| 2021 | $6,233 | $76,249 | $19,605 | $56,644 |
| 2020 | $6,066 | $73,550 | $18,911 | $54,639 |
| 2019 | $5,913 | $70,396 | $18,100 | $52,296 |
| 2018 | $5,627 | $65,031 | $16,721 | $48,310 |
| 2017 | $5,503 | $61,263 | $15,752 | $45,511 |
| 2016 | $5,411 | $57,459 | $14,774 | $42,685 |
| 2013 | -- | $57,846 | $13,783 | $44,063 |
Source: Public Records
Map
Nearby Homes
- 266 Grandview Ct
- 16 Brian Ct
- 1235 Fairmont Ct
- 909 Roger St
- 135 Arquilla Dr
- 700 Fairfield Ln
- LOT 3 Blackhawk Dr
- Lots 10 & 11 Ramble Rd
- 305 Buckingham Dr
- 721 Brentwood Ct
- 807 Menominee Dr
- 809 Menominee Dr
- 661 Majestic Dr
- 1820 Crofton Dr
- 741 Regal Ln
- 900 Windstone Ct
- 113 Pheasant Trail
- 937 Mesa Dr
- 615 Harper Dr
- 101 Oakleaf Rd
- 335 Partridge Ct
- 315 Partridge Ct
- 320 Glenwood Ct
- 330 Glenwood Ct
- 310 Glenwood Ct
- 345 Partridge Ct
- 320 Partridge Ct
- 305 Partridge Ct
- 310 Partridge Ct
- 340 Glenwood Ct
- 300 Glenwood Ct
- 340 Partridge Ct
- 355 Partridge Ct
- 300 Partridge Ct
- 350 Glenwood Ct
- 325 Glenwood Ct
- 335 Glenwood Ct
- 350 Partridge Ct
- 365 Partridge Ct
- 345 Glenwood Ct