325 Riptide Ct Pittsburg, CA 94565
Woodland Hills NeighborhoodEstimated Value: $461,934 - $492,000
3
Beds
1
Bath
1,000
Sq Ft
$470/Sq Ft
Est. Value
About This Home
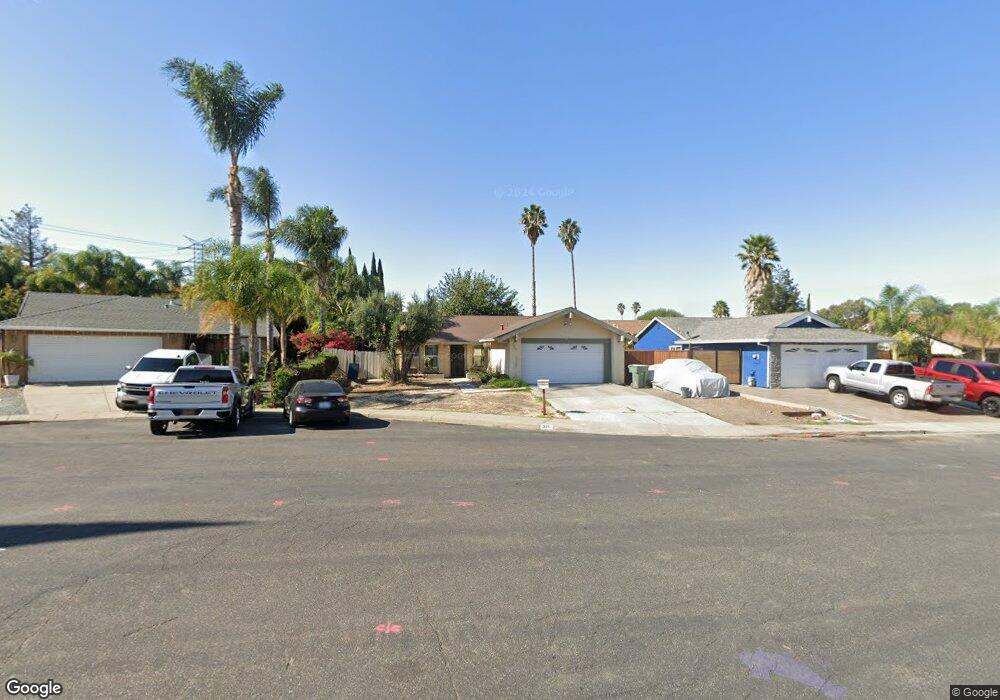
This home is located at 325 Riptide Ct, Pittsburg, CA 94565 and is currently estimated at $470,484, approximately $470 per square foot. 325 Riptide Ct is a home located in Contra Costa County with nearby schools including Willow Cove Elementary School, Rancho Medanos Junior High School, and Pittsburg Senior High School.
Ownership History
Date
Name
Owned For
Owner Type
Purchase Details
Closed on
Oct 10, 2016
Sold by
Ricardo Ernesto O and Ricardo Luz A
Bought by
Ricardo Ernesto O and Ricardo Luz A
Current Estimated Value
Home Financials for this Owner
Home Financials are based on the most recent Mortgage that was taken out on this home.
Original Mortgage
$160,000
Interest Rate
3.46%
Mortgage Type
New Conventional
Purchase Details
Closed on
Jul 26, 2004
Sold by
Ricardo Ernesto O and Ricardo Luz A
Bought by
Ricardo Ernesto O and Ricardo Luz A
Purchase Details
Closed on
Dec 3, 2002
Sold by
Ricardo Ernesto O
Bought by
Ricardo Ernesto O and Ricardo Luz A
Home Financials for this Owner
Home Financials are based on the most recent Mortgage that was taken out on this home.
Original Mortgage
$135,000
Interest Rate
6.06%
Mortgage Type
Purchase Money Mortgage
Create a Home Valuation Report for This Property
The Home Valuation Report is an in-depth analysis detailing your home's value as well as a comparison with similar homes in the area
Home Values in the Area
Average Home Value in this Area
Purchase History
| Date | Buyer | Sale Price | Title Company |
|---|---|---|---|
| Ricardo Ernesto O | -- | Placer Title Company | |
| Ricardo Ernesto O | -- | Placer Title Company | |
| Ricardo Ernesto O | -- | -- | |
| Ricardo Ernesto O | -- | Fidelity National Title |
Source: Public Records
Mortgage History
| Date | Status | Borrower | Loan Amount |
|---|---|---|---|
| Closed | Ricardo Ernesto O | $160,000 | |
| Closed | Ricardo Ernesto O | $135,000 |
Source: Public Records
Tax History
| Year | Tax Paid | Tax Assessment Tax Assessment Total Assessment is a certain percentage of the fair market value that is determined by local assessors to be the total taxable value of land and additions on the property. | Land | Improvement |
|---|---|---|---|---|
| 2025 | $2,509 | $158,884 | $56,578 | $102,306 |
| 2024 | $2,454 | $155,769 | $55,469 | $100,300 |
| 2023 | $2,454 | $152,716 | $54,382 | $98,334 |
| 2022 | $2,480 | $149,722 | $53,316 | $96,406 |
| 2021 | $2,467 | $146,787 | $52,271 | $94,516 |
| 2019 | $2,342 | $142,435 | $50,722 | $91,713 |
| 2018 | $2,256 | $139,643 | $49,728 | $89,915 |
| 2017 | $2,230 | $136,905 | $48,753 | $88,152 |
| 2016 | $2,039 | $134,222 | $47,798 | $86,424 |
| 2015 | $2,154 | $132,207 | $47,081 | $85,126 |
| 2014 | $2,083 | $129,618 | $46,159 | $83,459 |
Source: Public Records
Map
Nearby Homes
- 148 Spinnaker Way
- 113 Loftus Rd
- 1526 Willow Pass Rd Unit 42
- 1526 Willow Pass Rd Unit 16
- 2121 Apricot Ct
- 229 E Catamaran Cir
- 346 Melanie Dr
- 24 Mountain View Ave
- 191 Maureen Cir
- 343 Bernauer
- 68 - 76 Bayview Ave
- 0 Mountain View Ave
- 742 Wedgewood Dr
- 2132 Misty Ct
- 79 Bella Vista Ave
- 2171 Rain Drop Cir
- 64 S Bella Monte Ave
- 1988 Calaveras Dr
- 1998 Calaveras Dr
- 3142 Cortina Dr
- 321 Riptide Ct
- 329 Riptide Ct
- 316 Ensign Ct
- 312 Ensign Ct
- 313 Riptide Ct
- 331 Riptide Ct
- 322 Ensign Ct
- 306 Ensign Ct
- 320 Riptide Ct
- 324 Riptide Ct
- 332 Riptide Ct
- 309 Riptide Ct
- 328 Riptide Ct
- 314 Riptide Ct
- 351 Schooner Way
- 347 Schooner Way
- 300 Ensign Ct
- 355 Schooner Way
- 343 Schooner Way
- 323 Ensign Ct
Your Personal Tour Guide
Ask me questions while you tour the home.