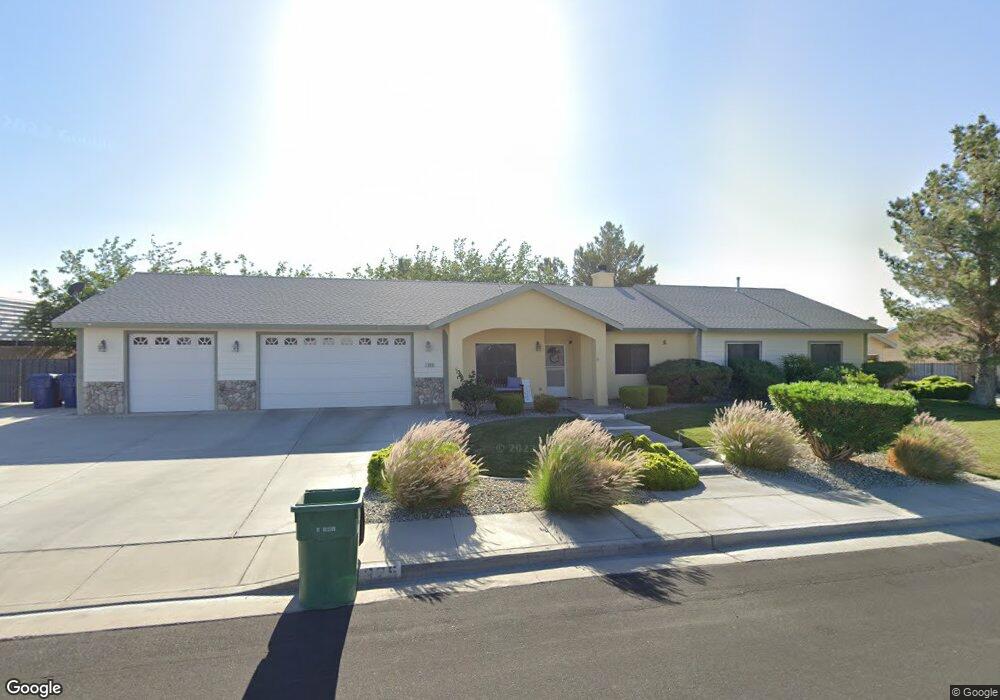
325 S Inyo St Ridgecrest, CA 93555
Estimated Value: $349,897 - $438,000
4
Beds
2
Baths
1,785
Sq Ft
$217/Sq Ft
Est. Value
About This Home
This home is located at 325 S Inyo St, Ridgecrest, CA 93555 and is currently estimated at $388,224, approximately $217 per square foot. 325 S Inyo St is a home located in Kern County with nearby schools including Faller Elementary School, James Monroe Middle School, and Burroughs High School.
Ownership History
Date
Name
Owned For
Owner Type
Purchase Details
Closed on
May 8, 2024
Sold by
Lamay Gerry C and Lamay Samantha A
Bought by
Samantha Ann Lamay And Gerry Charles Lamay Ii and Lamay
Current Estimated Value
Purchase Details
Closed on
Jun 27, 2016
Sold by
Childs Karen J and Karen J Childs Living Trust
Bought by
Lamay Gerry C and Lamay Samantha A
Home Financials for this Owner
Home Financials are based on the most recent Mortgage that was taken out on this home.
Original Mortgage
$278,632
Interest Rate
3.97%
Mortgage Type
VA
Purchase Details
Closed on
Feb 21, 2009
Sold by
Childs Karen J
Bought by
Childs Karen J and Karen J Childs Living Trust
Purchase Details
Closed on
Dec 6, 2004
Sold by
Emerald Point Development Inc
Bought by
Childs Karen J
Create a Home Valuation Report for This Property
The Home Valuation Report is an in-depth analysis detailing your home's value as well as a comparison with similar homes in the area
Home Values in the Area
Average Home Value in this Area
Purchase History
| Date | Buyer | Sale Price | Title Company |
|---|---|---|---|
| Samantha Ann Lamay And Gerry Charles Lamay Ii | -- | None Listed On Document | |
| Lamay Gerry C | $275,000 | First American Title Company | |
| Childs Karen J | -- | None Available | |
| Childs Karen J | $226,000 | First American Title |
Source: Public Records
Mortgage History
| Date | Status | Borrower | Loan Amount |
|---|---|---|---|
| Previous Owner | Lamay Gerry C | $278,632 |
Source: Public Records
Tax History Compared to Growth
Tax History
| Year | Tax Paid | Tax Assessment Tax Assessment Total Assessment is a certain percentage of the fair market value that is determined by local assessors to be the total taxable value of land and additions on the property. | Land | Improvement |
|---|---|---|---|---|
| 2025 | $3,925 | $319,154 | $46,420 | $272,734 |
| 2024 | $3,806 | $312,897 | $45,510 | $267,387 |
| 2023 | $3,806 | $306,763 | $44,618 | $262,145 |
| 2022 | $3,728 | $300,749 | $43,744 | $257,005 |
| 2021 | $3,640 | $294,853 | $42,887 | $251,966 |
| 2020 | $3,562 | $291,831 | $42,448 | $249,383 |
| 2019 | $3,499 | $291,831 | $42,448 | $249,383 |
| 2018 | $3,430 | $280,500 | $40,800 | $239,700 |
| 2017 | $3,417 | $275,000 | $40,000 | $235,000 |
| 2016 | $3,014 | $245,000 | $61,000 | $184,000 |
| 2015 | $2,233 | $173,000 | $43,000 | $130,000 |
| 2014 | $2,267 | $187,000 | $47,000 | $140,000 |
Source: Public Records
Map
Nearby Homes
- 400 Vista St
- 432 Vista St
- 1132 Briarwood Ave
- 400 Acacia St
- 1012 W Langley Ave
- 1236 W Langley Ave
- 111 S Mahan St
- 1320 W Saint George Ave
- 0 W Saint George Ave
- 1409 W Upjohn Ave
- 349 S Margalo St
- 0 W Boston Ave
- 0 St George Unit 2607540
- 1316 W Mariposa Ave
- 1233 W Langley Ave
- 1213 W Willow Ave
- 0 W Coronado Ave Unit SR25097540
- 0 W Coronado Ave Unit 25003301
- 0 W Coronado Ave Unit 2606380
- 0 S Yorktown St