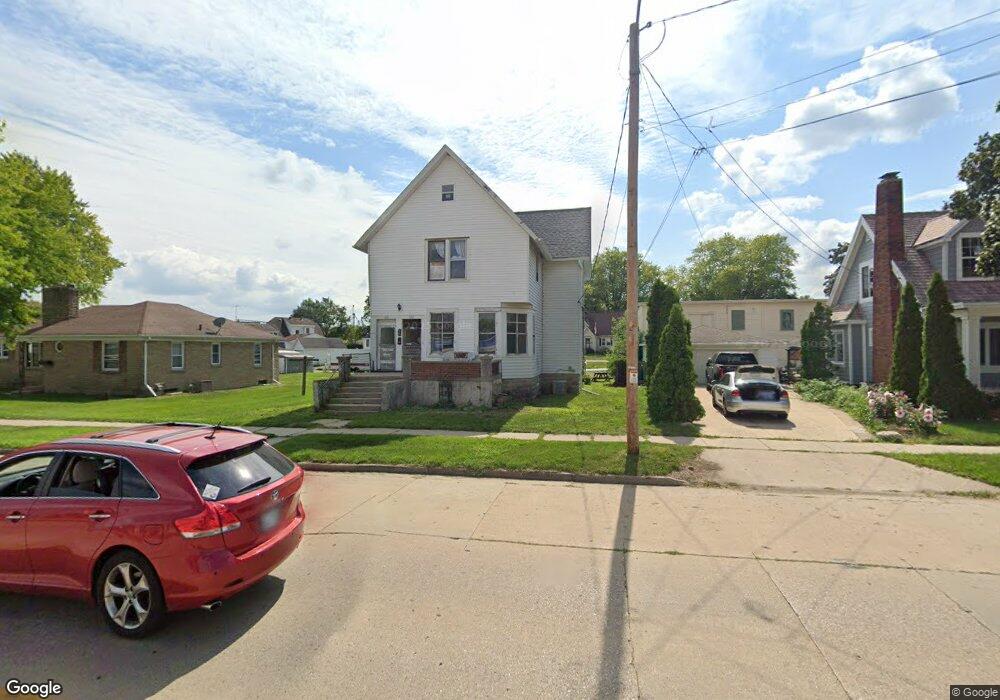
325 S Pine St Burlington, WI 53105
Estimated Value: $268,000 - $298,000
4
Beds
2
Baths
2,460
Sq Ft
$118/Sq Ft
Est. Value
About This Home
This home is located at 325 S Pine St, Burlington, WI 53105 and is currently estimated at $289,140, approximately $117 per square foot. 325 S Pine St is a home located in Racine County with nearby schools including Waller Elementary School, Cooper Montessori School, and Nettie E. Karcher School.
Ownership History
Date
Name
Owned For
Owner Type
Purchase Details
Closed on
Nov 1, 2024
Sold by
325 S Pine Street Llc
Bought by
Hill Jonathan and Hill Angela
Current Estimated Value
Home Financials for this Owner
Home Financials are based on the most recent Mortgage that was taken out on this home.
Original Mortgage
$270,019
Outstanding Balance
$267,311
Interest Rate
6.08%
Mortgage Type
FHA
Estimated Equity
$21,829
Purchase Details
Closed on
Apr 1, 2024
Sold by
Torgerson Brian J
Bought by
325 S Pine Street Llc
Purchase Details
Closed on
Mar 29, 2019
Sold by
Torgerson Brian J
Bought by
325 S Pine Street Llc
Home Financials for this Owner
Home Financials are based on the most recent Mortgage that was taken out on this home.
Original Mortgage
$86,670
Interest Rate
5.5%
Mortgage Type
Land Contract Argmt. Of Sale
Create a Home Valuation Report for This Property
The Home Valuation Report is an in-depth analysis detailing your home's value as well as a comparison with similar homes in the area
Home Values in the Area
Average Home Value in this Area
Purchase History
| Date | Buyer | Sale Price | Title Company |
|---|---|---|---|
| Hill Jonathan | $275,000 | None Listed On Document | |
| Hill Jonathan | $275,000 | None Listed On Document | |
| 325 S Pine Street Llc | $96,300 | Fidelity Title Inc. | |
| 325 S Pine Street Llc | $96,300 | Fidelity Title Inc |
Source: Public Records
Mortgage History
| Date | Status | Borrower | Loan Amount |
|---|---|---|---|
| Open | Hill Jonathan | $270,019 | |
| Closed | Hill Jonathan | $270,019 | |
| Previous Owner | 325 S Pine Street Llc | $86,670 |
Source: Public Records
Property History
| Date | Event | Price | List to Sale | Price per Sq Ft |
|---|---|---|---|---|
| 02/10/2025 02/10/25 | Off Market | -- | -- | -- |
| 01/06/2025 01/06/25 | For Rent | -- | -- | -- |
Tax History Compared to Growth
Tax History
| Year | Tax Paid | Tax Assessment Tax Assessment Total Assessment is a certain percentage of the fair market value that is determined by local assessors to be the total taxable value of land and additions on the property. | Land | Improvement |
|---|---|---|---|---|
| 2024 | $1,809 | $129,000 | $17,400 | $111,600 |
| 2023 | $1,863 | $129,000 | $17,400 | $111,600 |
| 2022 | $1,892 | $112,400 | $17,400 | $95,000 |
| 2021 | $1,787 | $100,700 | $17,400 | $83,300 |
| 2020 | $1,805 | $96,300 | $17,400 | $78,900 |
| 2019 | $1,869 | $96,300 | $17,400 | $78,900 |
| 2018 | $1,916 | $96,300 | $17,400 | $78,900 |
| 2017 | $2,179 | $96,300 | $17,400 | $78,900 |
| 2016 | $2,234 | $92,600 | $17,400 | $75,200 |
| 2015 | $2,094 | $92,600 | $17,400 | $75,200 |
| 2014 | $2,312 | $103,800 | $17,400 | $86,400 |
| 2013 | $2,429 | $103,800 | $17,400 | $86,400 |
Source: Public Records
Map
Nearby Homes