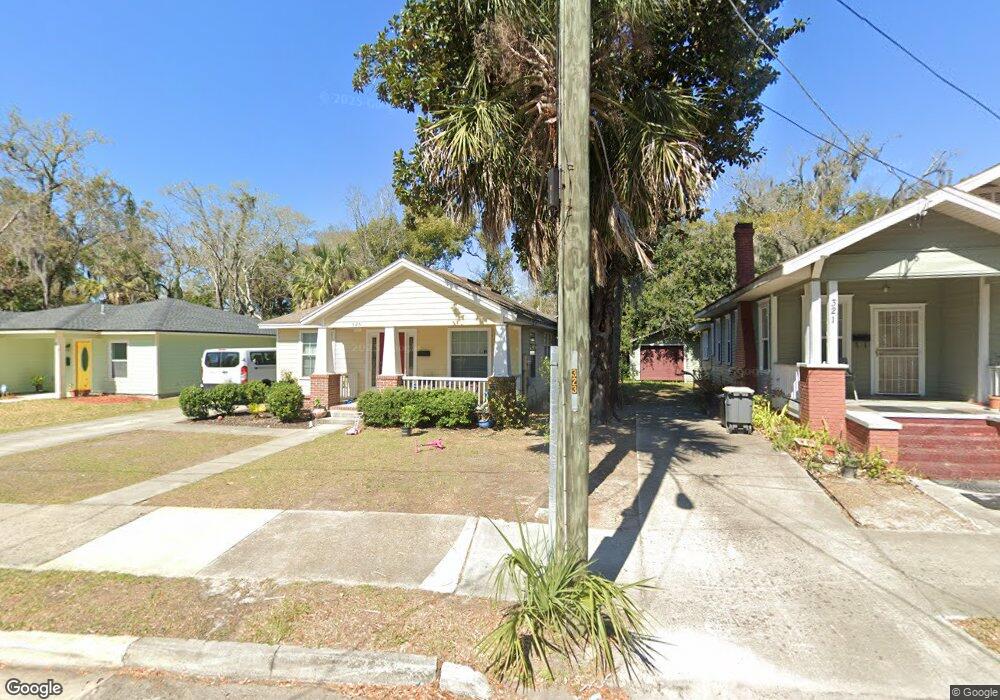
325 W 22nd St Jacksonville, FL 32206
Brentwood NeighborhoodEstimated Value: $154,000 - $193,000
3
Beds
2
Baths
1,589
Sq Ft
$114/Sq Ft
Est. Value
About This Home
This home is located at 325 W 22nd St, Jacksonville, FL 32206 and is currently estimated at $180,637, approximately $113 per square foot. 325 W 22nd St is a home located in Duval County with nearby schools including North Shore Elementary School, Matthew W. Gilbert Middle School, and Jean Ribault High School.
Ownership History
Date
Name
Owned For
Owner Type
Purchase Details
Closed on
Sep 16, 2011
Sold by
Metro North Community Development Corpor
Bought by
Nettleton Marc
Current Estimated Value
Home Financials for this Owner
Home Financials are based on the most recent Mortgage that was taken out on this home.
Original Mortgage
$6,878
Outstanding Balance
$4,737
Interest Rate
4.38%
Mortgage Type
Negative Amortization
Estimated Equity
$175,900
Purchase Details
Closed on
Jun 23, 2005
Sold by
County Of Duval
Bought by
Metro North Cmnty Development Corp Inc
Create a Home Valuation Report for This Property
The Home Valuation Report is an in-depth analysis detailing your home's value as well as a comparison with similar homes in the area
Home Values in the Area
Average Home Value in this Area
Purchase History
| Date | Buyer | Sale Price | Title Company |
|---|---|---|---|
| Nettleton Marc | $65,000 | Title Clearinghouse Of Jacks | |
| Metro North Cmnty Development Corp Inc | $6,240 | -- |
Source: Public Records
Mortgage History
| Date | Status | Borrower | Loan Amount |
|---|---|---|---|
| Open | Nettleton Marc | $6,878 |
Source: Public Records
Tax History Compared to Growth
Tax History
| Year | Tax Paid | Tax Assessment Tax Assessment Total Assessment is a certain percentage of the fair market value that is determined by local assessors to be the total taxable value of land and additions on the property. | Land | Improvement |
|---|---|---|---|---|
| 2025 | $773 | $70,110 | -- | -- |
| 2024 | $765 | $68,135 | -- | -- |
| 2023 | $765 | $66,151 | $0 | $0 |
| 2022 | $659 | $53,864 | $0 | $0 |
| 2021 | $663 | $52,296 | $0 | $0 |
| 2020 | $661 | $51,574 | $0 | $0 |
| 2019 | $661 | $50,415 | $0 | $0 |
| 2018 | $653 | $49,475 | $0 | $0 |
| 2017 | $639 | $48,458 | $0 | $0 |
| 2016 | $629 | $47,462 | $0 | $0 |
| 2015 | $630 | $47,133 | $0 | $0 |
| 2014 | $678 | $56,657 | $0 | $0 |
Source: Public Records
Map
Nearby Homes