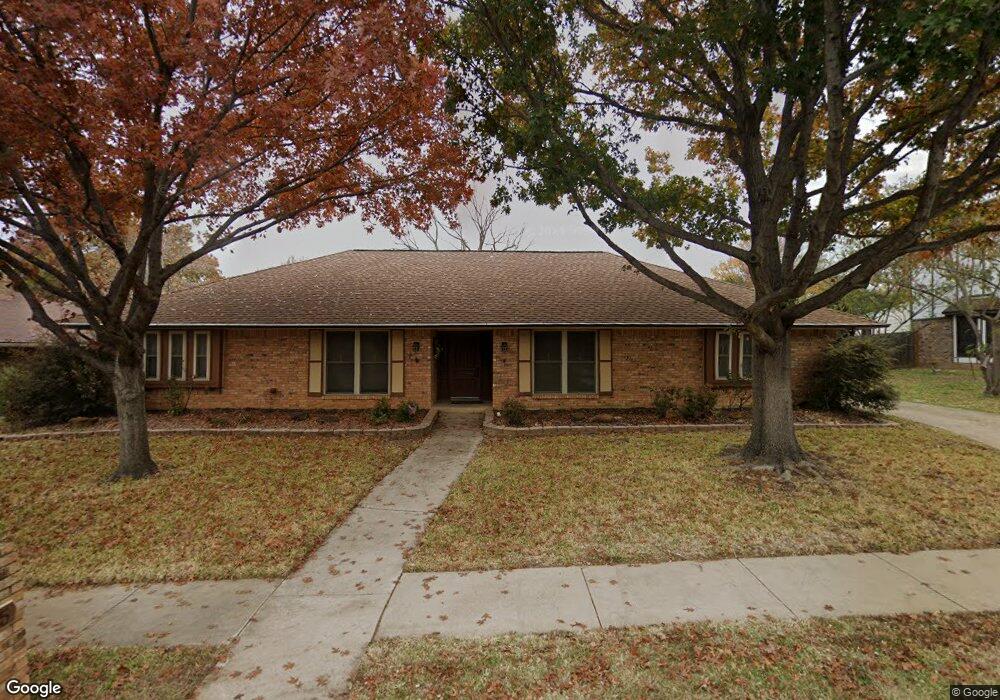
325 Warbler Dr Bedford, TX 76021
Estimated Value: $431,297 - $490,000
4
Beds
3
Baths
2,270
Sq Ft
$201/Sq Ft
Est. Value
About This Home
This home is located at 325 Warbler Dr, Bedford, TX 76021 and is currently estimated at $456,074, approximately $200 per square foot. 325 Warbler Dr is a home located in Tarrant County with nearby schools including Bedford Heights Elementary School, Bedford Junior High School, and L.D. Bell High School.
Ownership History
Date
Name
Owned For
Owner Type
Purchase Details
Closed on
Feb 14, 2013
Sold by
Hawkins Linda Frances and Blankenship Linda
Bought by
Rushing Richard and Rushing Pamela
Current Estimated Value
Home Financials for this Owner
Home Financials are based on the most recent Mortgage that was taken out on this home.
Original Mortgage
$158,400
Outstanding Balance
$110,577
Interest Rate
3.38%
Mortgage Type
New Conventional
Estimated Equity
$345,497
Purchase Details
Closed on
Jul 10, 2002
Sold by
Hawkins Norman Tracy
Bought by
Hawkins Linda
Purchase Details
Closed on
Jun 10, 1997
Sold by
Jason Barry L and Gray Irene E
Bought by
Hawkins Norman Tracy and Hawkins Linda Frances
Home Financials for this Owner
Home Financials are based on the most recent Mortgage that was taken out on this home.
Original Mortgage
$124,450
Interest Rate
7.98%
Purchase Details
Closed on
Feb 10, 1994
Sold by
Jason Barry L
Bought by
Gray Irene E
Create a Home Valuation Report for This Property
The Home Valuation Report is an in-depth analysis detailing your home's value as well as a comparison with similar homes in the area
Home Values in the Area
Average Home Value in this Area
Purchase History
| Date | Buyer | Sale Price | Title Company |
|---|---|---|---|
| Rushing Richard | -- | None Available | |
| Hawkins Linda | -- | -- | |
| Hawkins Norman Tracy | -- | Ticor Land Title Co | |
| Gray Irene E | -- | Commonwealth Land Title |
Source: Public Records
Mortgage History
| Date | Status | Borrower | Loan Amount |
|---|---|---|---|
| Open | Rushing Richard | $158,400 | |
| Previous Owner | Hawkins Norman Tracy | $124,450 |
Source: Public Records
Tax History
| Year | Tax Paid | Tax Assessment Tax Assessment Total Assessment is a certain percentage of the fair market value that is determined by local assessors to be the total taxable value of land and additions on the property. | Land | Improvement |
|---|---|---|---|---|
| 2025 | $4,579 | $346,120 | $100,000 | $246,120 |
| 2024 | $4,579 | $402,678 | $100,000 | $302,678 |
| 2023 | $5,215 | $395,416 | $75,000 | $320,416 |
| 2022 | $5,399 | $247,182 | $75,000 | $172,182 |
| 2021 | $5,823 | $247,182 | $75,000 | $172,182 |
| 2020 | $5,877 | $247,182 | $75,000 | $172,182 |
| 2019 | $6,480 | $266,755 | $75,000 | $191,755 |
| 2018 | $6,040 | $264,337 | $75,000 | $189,337 |
| 2017 | $5,813 | $261,764 | $45,000 | $216,764 |
| 2016 | $5,285 | $251,493 | $45,000 | $206,493 |
| 2015 | $4,712 | $198,600 | $26,000 | $172,600 |
| 2014 | $4,712 | $198,600 | $26,000 | $172,600 |
Source: Public Records
Map
Nearby Homes
- 413 Blue Jay Ct
- 405 Woodbriar Ct
- 604 Robinhood Ln
- 3613 Harber Dr
- 3006 Carolyn Ct
- 3002 Carolyn Ct
- 410 Carolyn Dr
- 3716 Sweetbriar Ln
- 3605 Spring Valley Dr
- 704 Morning Glory Ln
- 104 Greenbriar Ln
- 3212 Timber View Cir
- 417 Sunnybrook Ct
- 3108 Spring Valley Dr
- 116 Cheek Sparger Rd
- 3609 Wayne Ct
- 2620 Brookridge Dr
- 412 Elisha Dr
- 840 Ridge Dr
- 4108 Wellington Dr
- 321 Warbler Dr
- 333 Warbler Dr
- 311 Quail Crest Dr
- 309 Quail Crest Dr
- 313 Quail Crest Dr
- 317 Warbler Dr
- 332 Warbler Dr
- 324 Warbler Dr
- 307 Quail Crest Dr
- 320 Warbler Dr
- 401 Warbler Dr
- 313 Warbler Dr
- 401 Quail Crest Dr
- 400 Warbler Dr
- 333 Eagle Dr
- 316 Warbler Dr
- 304 Quail Crest Dr
- 305 Quail Crest Dr
- 325 Eagle Dr
- 308 Quail Crest Dr
Your Personal Tour Guide
Ask me questions while you tour the home.