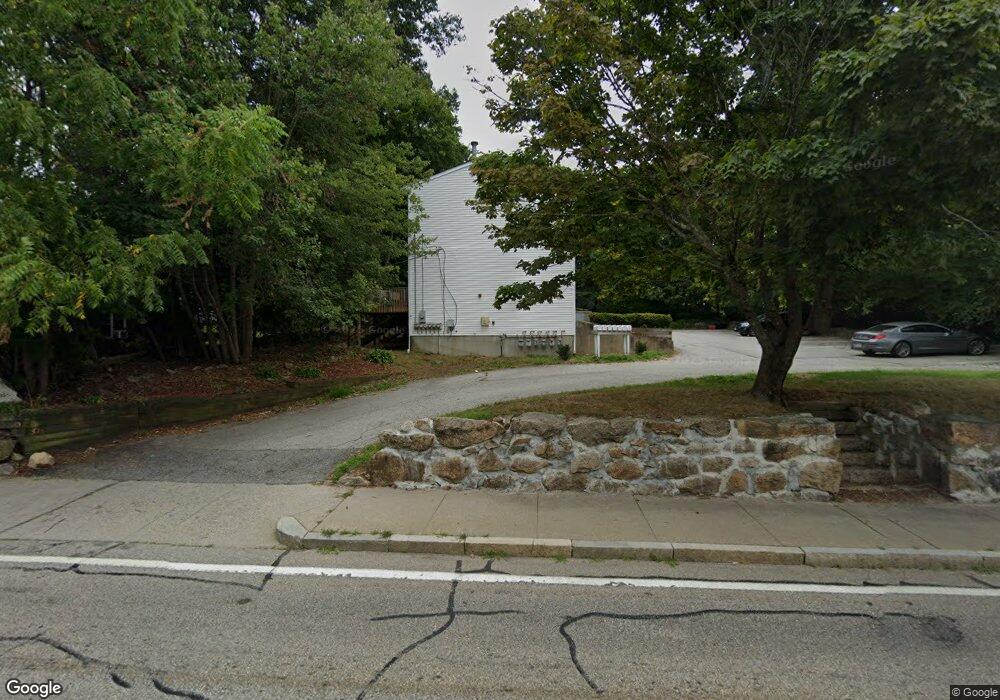
325 Washington St Unit 5 West Warwick, RI 02893
West Warwick Centre NeighborhoodEstimated Value: $177,000 - $201,000
1
Bed
1
Bath
720
Sq Ft
$270/Sq Ft
Est. Value
About This Home
This home is located at 325 Washington St Unit 5, West Warwick, RI 02893 and is currently estimated at $194,076, approximately $269 per square foot. 325 Washington St Unit 5 is a home located in Kent County with nearby schools including West Warwick High School.
Ownership History
Date
Name
Owned For
Owner Type
Purchase Details
Closed on
Jun 22, 2016
Sold by
Davis Steven
Bought by
Sartwell Eric R
Current Estimated Value
Home Financials for this Owner
Home Financials are based on the most recent Mortgage that was taken out on this home.
Original Mortgage
$60,625
Outstanding Balance
$48,251
Interest Rate
3.57%
Mortgage Type
Purchase Money Mortgage
Estimated Equity
$145,825
Purchase Details
Closed on
Mar 31, 2010
Sold by
Boffi Erika K
Bought by
Davis Steven
Home Financials for this Owner
Home Financials are based on the most recent Mortgage that was taken out on this home.
Original Mortgage
$59,403
Interest Rate
4.94%
Mortgage Type
Purchase Money Mortgage
Purchase Details
Closed on
Apr 22, 2005
Sold by
Montgomery William F
Bought by
Tuck Ericka K
Home Financials for this Owner
Home Financials are based on the most recent Mortgage that was taken out on this home.
Original Mortgage
$106,700
Interest Rate
5.87%
Mortgage Type
Purchase Money Mortgage
Purchase Details
Closed on
May 25, 2004
Sold by
Maple Rlty
Bought by
Montgomery William F
Create a Home Valuation Report for This Property
The Home Valuation Report is an in-depth analysis detailing your home's value as well as a comparison with similar homes in the area
Home Values in the Area
Average Home Value in this Area
Purchase History
| Date | Buyer | Sale Price | Title Company |
|---|---|---|---|
| Sartwell Eric R | $62,500 | -- | |
| Davis Steven | $60,500 | -- | |
| Tuck Ericka K | $110,000 | -- | |
| Montgomery William F | $75,000 | -- |
Source: Public Records
Mortgage History
| Date | Status | Borrower | Loan Amount |
|---|---|---|---|
| Open | Sartwell Eric R | $60,625 | |
| Previous Owner | Montgomery William F | $59,403 | |
| Previous Owner | Montgomery William F | $106,700 |
Source: Public Records
Tax History Compared to Growth
Tax History
| Year | Tax Paid | Tax Assessment Tax Assessment Total Assessment is a certain percentage of the fair market value that is determined by local assessors to be the total taxable value of land and additions on the property. | Land | Improvement |
|---|---|---|---|---|
| 2025 | $2,222 | $155,500 | $0 | $155,500 |
| 2024 | $1,506 | $80,600 | $0 | $80,600 |
| 2023 | $1,477 | $80,600 | $0 | $80,600 |
| 2022 | $1,454 | $80,600 | $0 | $80,600 |
| 2021 | $1,433 | $62,300 | $0 | $62,300 |
| 2020 | $1,433 | $62,300 | $0 | $62,300 |
| 2019 | $1,827 | $62,300 | $0 | $62,300 |
| 2018 | $1,519 | $55,900 | $0 | $55,900 |
| 2017 | $1,471 | $55,900 | $0 | $55,900 |
| 2016 | $1,444 | $55,900 | $0 | $55,900 |
| 2015 | $1,410 | $54,300 | $0 | $54,300 |
| 2014 | $1,379 | $54,300 | $0 | $54,300 |
Source: Public Records
Map
Nearby Homes
- 325 Washington St Unit D
- 325 Washington St Unit 2
- 325 Washington St Unit 4
- 325 Washington St Unit 1
- 325 Washington St Unit 325
- 325 Washington St
- 325 Washington St Unit C
- 325 Washington St Unit B
- 325 Washington St Unit a
- 325 Washington St Unit F
- 325 Washington St Unit E
- 331 Washington St
- 8 Ritchotte Ct
- 319 Washington St
- 10 West St
- 11 Ritchotte Ct
- 11 Ritchotte Ct
- 335 Washington St Unit 2
- 0 Ritchotte Ct
- 2 Ritchotte Ct