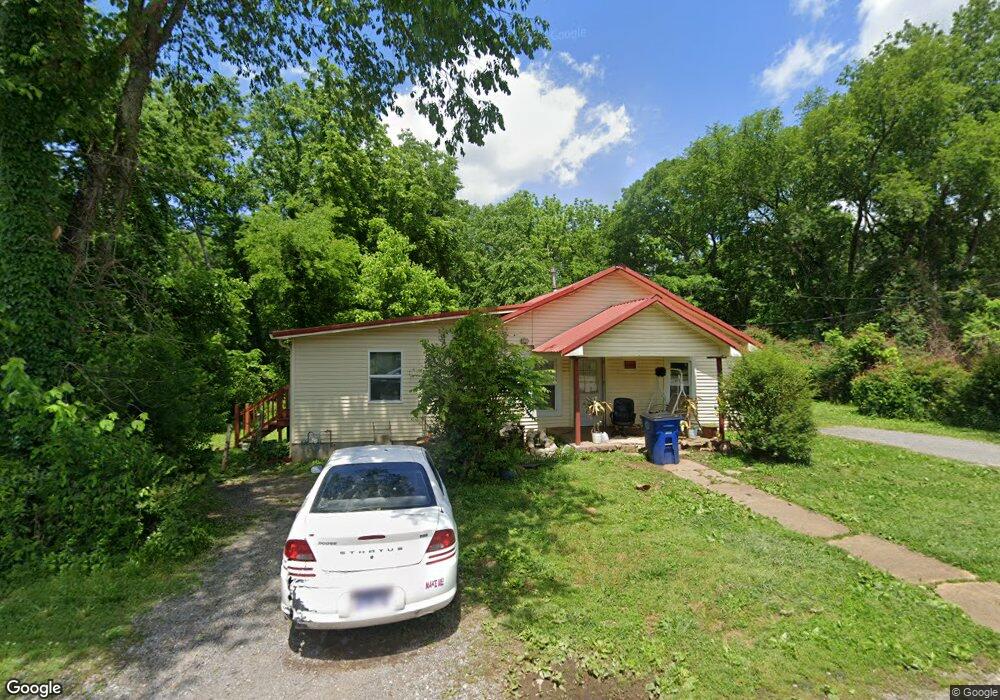
325 White St Shelbyville, TN 37160
Estimated Value: $140,556 - $167,000
--
Bed
1
Bath
918
Sq Ft
$168/Sq Ft
Est. Value
About This Home
This home is located at 325 White St, Shelbyville, TN 37160 and is currently estimated at $154,639, approximately $168 per square foot. 325 White St is a home located in Bedford County with nearby schools including East Side Elementary School, Harris Middle School, and Christian Chapel Academy.
Ownership History
Date
Name
Owned For
Owner Type
Purchase Details
Closed on
Oct 7, 2016
Current Estimated Value
Purchase Details
Closed on
Oct 4, 2016
Sold by
Parker William C
Bought by
Parker William C and Parker Benjamin C
Purchase Details
Closed on
May 7, 2012
Sold by
Napper James
Bought by
Parker William C and Parker Billie M
Purchase Details
Closed on
Apr 12, 2012
Sold by
Sosa Ricardo Edgar Lira
Bought by
Parker Billie and Freeman James R
Purchase Details
Closed on
Nov 18, 2010
Sold by
Freeman Robert
Bought by
Sosa Ricardo Edgar Lira
Purchase Details
Closed on
Feb 26, 2010
Sold by
Napper Carolyn J
Bought by
Napper James and Napper Carolyn
Purchase Details
Closed on
Jan 25, 2010
Sold by
Napper Carolyn J
Bought by
Parker William C
Purchase Details
Closed on
Dec 3, 2009
Sold by
Calhoun Deborah Kay
Bought by
Arnold Billy Mack
Purchase Details
Closed on
Jan 23, 2008
Sold by
Thompson Elvie
Bought by
Freeman Robert
Purchase Details
Closed on
Jun 27, 2003
Sold by
C & N Properties
Bought by
Arnold George
Purchase Details
Closed on
Apr 18, 1969
Bought by
Parker Donald and Parker Edith
Create a Home Valuation Report for This Property
The Home Valuation Report is an in-depth analysis detailing your home's value as well as a comparison with similar homes in the area
Home Values in the Area
Average Home Value in this Area
Purchase History
| Date | Buyer | Sale Price | Title Company |
|---|---|---|---|
| -- | -- | -- | |
| Parker William C | -- | -- | |
| Parker William C | $5,000 | -- | |
| Parker Billie | $5,000 | -- | |
| Sosa Ricardo Edgar Lira | $2,000 | -- | |
| Napper James | $5,000 | -- | |
| Parker William C | $15,000 | -- | |
| Arnold Billy Mack | -- | -- | |
| Freeman Robert | $1,200 | -- | |
| Arnold George | $1,400 | -- | |
| Parker Donald | -- | -- |
Source: Public Records
Tax History Compared to Growth
Tax History
| Year | Tax Paid | Tax Assessment Tax Assessment Total Assessment is a certain percentage of the fair market value that is determined by local assessors to be the total taxable value of land and additions on the property. | Land | Improvement |
|---|---|---|---|---|
| 2025 | -- | $30,300 | $0 | $0 |
| 2024 | -- | $22,600 | $5,875 | $16,725 |
| 2023 | $334 | $22,600 | $5,875 | $16,725 |
| 2022 | $885 | $22,600 | $5,875 | $16,725 |
| 2021 | $803 | $22,600 | $5,875 | $16,725 |
| 2020 | $573 | $22,600 | $5,875 | $16,725 |
| 2019 | $573 | $12,925 | $3,125 | $9,800 |
| 2018 | $560 | $12,925 | $3,125 | $9,800 |
| 2017 | $560 | $12,925 | $3,125 | $9,800 |
| 2016 | $554 | $12,925 | $3,125 | $9,800 |
| 2015 | $554 | $12,050 | $2,250 | $9,800 |
| 2014 | $472 | $12,028 | $0 | $0 |
Source: Public Records
Map
Nearby Homes
- 120 Dogwood Ct
- 222 Carter St
- 709 Belmont Ave
- 102 Germantown Rd
- 220 Walnut St
- 215 Coney Island Rd
- 211 S Fairoak St
- 0 E Depot St
- 112 Elizabeth St
- 207 Martha St
- 314 Maplewood Dr
- 464 Whitthorne St
- 627 E Lane St
- 631 E Lane St
- 418 Riverview Dr
- 611 Coble Cir
- 107 Rockwood Dr
- 527 Deery St
- 508 Lewis Ave
- 702 Adams Dr