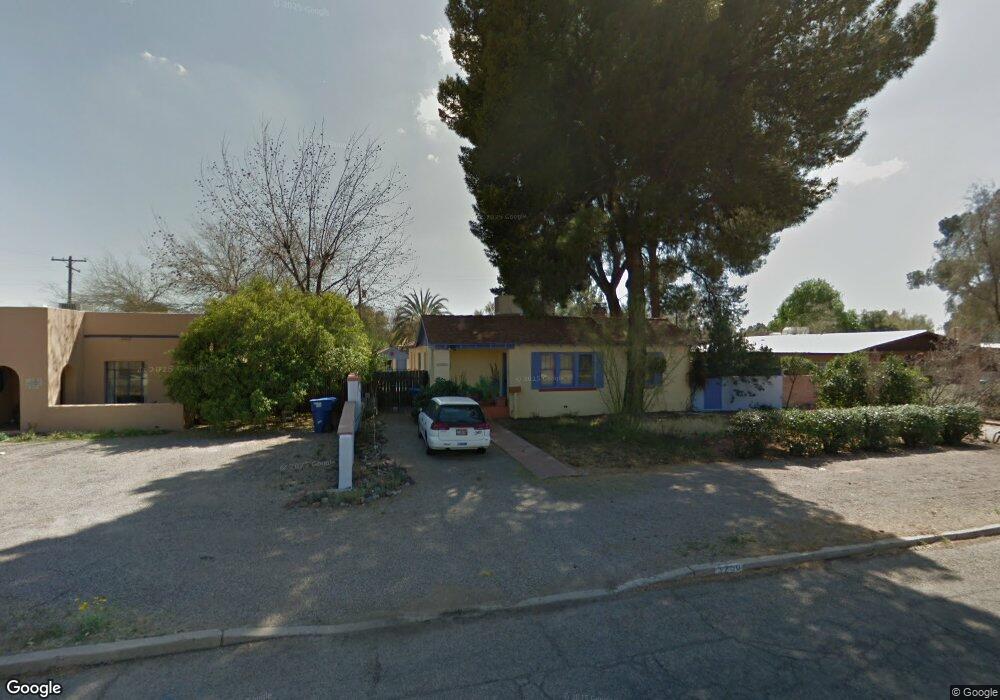
3250 E Linden St Tucson, AZ 85716
Palo Verde NeighborhoodEstimated Value: $248,870 - $347,000
Studio
1
Bath
1,120
Sq Ft
$269/Sq Ft
Est. Value
About This Home
This home is located at 3250 E Linden St, Tucson, AZ 85716 and is currently estimated at $301,468, approximately $269 per square foot. 3250 E Linden St is a home located in Pima County with nearby schools including Blenman Elementary School, Doolen Middle School, and Catalina High School.
Ownership History
Date
Name
Owned For
Owner Type
Purchase Details
Closed on
Jan 11, 2012
Sold by
Rollins Jim and Rollins Mary Eleanor
Bought by
Rollins Jim and Rollins Mary Eleanor
Current Estimated Value
Purchase Details
Closed on
May 16, 2011
Sold by
Gordon B & Valerie A Mustain Family Trus
Bought by
Mustain Valerie Andree
Purchase Details
Closed on
Jun 20, 2001
Sold by
Strahan Lorna J
Bought by
Strahan Lorna J and Oconnor Barbara Jo
Purchase Details
Closed on
Jul 27, 1999
Sold by
Simmons Iris
Bought by
Mustain Gordon B and Mustain Valerie A
Purchase Details
Closed on
Jan 27, 1995
Sold by
Cooley Thomas W and Cooley Mary T
Bought by
Simmons Iris
Purchase Details
Closed on
Jun 27, 1994
Sold by
Bookstaff Rose
Bought by
Silverman Lillian and Silverman Sandor
Purchase Details
Closed on
May 23, 1994
Sold by
Marshall Stephen J and Marshall Byron L
Bought by
Fitzgibbon Amy
Create a Home Valuation Report for This Property
The Home Valuation Report is an in-depth analysis detailing your home's value as well as a comparison with similar homes in the area
Home Values in the Area
Average Home Value in this Area
Purchase History
| Date | Buyer | Sale Price | Title Company |
|---|---|---|---|
| Rollins Jim | -- | None Available | |
| Mustain Valerie Andree | -- | None Available | |
| Mustain Valerie Andree | -- | None Available | |
| Mustain Valerie Andree | -- | None Available | |
| Strahan Lorna J | -- | Stewart Title | |
| Mustain Gordon B | -- | -- | |
| Simmons Iris | $105,000 | Fidelity National Title Agen | |
| Silverman Lillian | -- | -- | |
| Silverman Lillian | -- | -- | |
| Fitzgibbon Amy | -- | Fidelity National Title Agen |
Source: Public Records
Tax History
| Year | Tax Paid | Tax Assessment Tax Assessment Total Assessment is a certain percentage of the fair market value that is determined by local assessors to be the total taxable value of land and additions on the property. | Land | Improvement |
|---|---|---|---|---|
| 2026 | $2,155 | $19,397 | -- | -- |
| 2025 | $2,155 | $18,473 | -- | -- |
| 2024 | $1,934 | $17,593 | -- | -- |
| 2023 | $1,934 | $16,755 | $0 | $0 |
| 2022 | $1,949 | $15,958 | $0 | $0 |
| 2021 | $2,026 | $14,995 | $0 | $0 |
| 2020 | $1,945 | $14,995 | $0 | $0 |
| 2019 | $1,889 | $15,064 | $0 | $0 |
| 2018 | $1,802 | $13,601 | $0 | $0 |
| 2017 | $1,806 | $13,601 | $0 | $0 |
| 2016 | $1,804 | $13,272 | $0 | $0 |
| 2015 | $1,725 | $12,640 | $0 | $0 |
Source: Public Records
Map
Nearby Homes
- 3022 E Seneca St
- 3304 E Elida St
- 3005 E Waverly St
- 3432 E Linden St Unit 1
- 2921 E Waverly St
- 3243 E Camden St
- 3201 E Fairmount St
- 2821 E Waverly St
- 2878 E Vespers Place
- 2733 E Elm St
- 3742 E Fairmount St
- 2214 N Richey Blvd
- 3017 E Loretta Dr
- 2324 N Chrysler Dr
- 2439 N Richey Blvd
- 2711 E Grant Rd
- 2621 E Adams St
- 3457 E Cody St
- 1209 N Stewart Ave
- 2223 N Forgeus Ave
- 3244 E Linden St
- 3256 E Linden St
- 3238 E Linden St
- 2875 N Tuscon Blvd Unit 67
- 0 S Withheld Unit 21411914
- 0 S Withheld Unit 21421239
- 0 S Withheld Unit 21429316
- 3243 E Lester St
- 3237 E Lester St
- 1801 N Howard Blvd
- 3232 E Linden St
- 3231 E Lester St
- 3243 E Linden St
- 3302 E Linden St
- 3249 E Linden St
- 3221 E Lester St
- 3226 E Linden St
- 3301 E Lester St
- 3229 E Linden St
- 3308 E Linden St
Your Personal Tour Guide
Ask me questions while you tour the home.