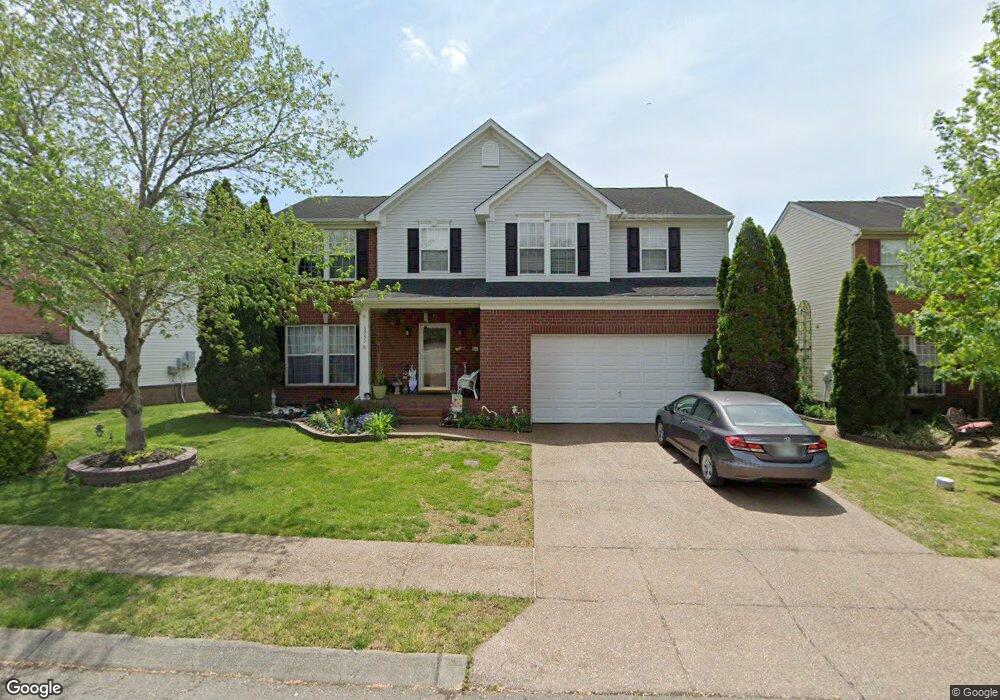
3251 Nolen Ln Franklin, TN 37064
West Franklin NeighborhoodEstimated Value: $652,000 - $721,000
--
Bed
3
Baths
2,260
Sq Ft
$298/Sq Ft
Est. Value
About This Home
This home is located at 3251 Nolen Ln, Franklin, TN 37064 and is currently estimated at $673,304, approximately $297 per square foot. 3251 Nolen Ln is a home located in Williamson County with nearby schools including Pearre Creek Elementary School, New Hope Academy, and Franklin Christian Academy.
Ownership History
Date
Name
Owned For
Owner Type
Purchase Details
Closed on
Aug 31, 2005
Sold by
Carlton Patrick and Carlton Valerie
Bought by
Campos Antonio Rocha
Current Estimated Value
Home Financials for this Owner
Home Financials are based on the most recent Mortgage that was taken out on this home.
Original Mortgage
$213,000
Outstanding Balance
$115,179
Interest Rate
6.12%
Mortgage Type
Purchase Money Mortgage
Estimated Equity
$558,125
Purchase Details
Closed on
Apr 1, 2004
Sold by
Fogelberg Todd and Fogelberg Sara S
Bought by
Carlton Patrick and Carlton Valerie
Home Financials for this Owner
Home Financials are based on the most recent Mortgage that was taken out on this home.
Original Mortgage
$171,900
Interest Rate
5.5%
Mortgage Type
Purchase Money Mortgage
Purchase Details
Closed on
Sep 15, 2000
Sold by
Nvr Inc
Bought by
Fogelberg Todd and Fogelberg Sara S
Home Financials for this Owner
Home Financials are based on the most recent Mortgage that was taken out on this home.
Original Mortgage
$158,100
Interest Rate
7.92%
Create a Home Valuation Report for This Property
The Home Valuation Report is an in-depth analysis detailing your home's value as well as a comparison with similar homes in the area
Home Values in the Area
Average Home Value in this Area
Purchase History
| Date | Buyer | Sale Price | Title Company |
|---|---|---|---|
| Campos Antonio Rocha | $238,000 | Southeast Title Of Tn Inc | |
| Carlton Patrick | $214,900 | Southeast Title Of Tenn | |
| Fogelberg Todd | $189,400 | -- |
Source: Public Records
Mortgage History
| Date | Status | Borrower | Loan Amount |
|---|---|---|---|
| Open | Campos Antonio Rocha | $213,000 | |
| Previous Owner | Carlton Patrick | $171,900 | |
| Previous Owner | Fogelberg Todd | $158,100 | |
| Closed | Carlton Patrick | $45,980 |
Source: Public Records
Tax History Compared to Growth
Tax History
| Year | Tax Paid | Tax Assessment Tax Assessment Total Assessment is a certain percentage of the fair market value that is determined by local assessors to be the total taxable value of land and additions on the property. | Land | Improvement |
|---|---|---|---|---|
| 2025 | $2,226 | $160,700 | $60,000 | $100,700 |
| 2024 | $2,226 | $103,250 | $25,000 | $78,250 |
| 2023 | $2,226 | $103,250 | $25,000 | $78,250 |
| 2022 | $2,226 | $103,250 | $25,000 | $78,250 |
| 2021 | $2,226 | $103,250 | $25,000 | $78,250 |
| 2020 | $2,038 | $79,075 | $18,750 | $60,325 |
| 2019 | $2,038 | $79,075 | $18,750 | $60,325 |
| 2018 | $1,983 | $79,075 | $18,750 | $60,325 |
| 2017 | $1,967 | $79,075 | $18,750 | $60,325 |
| 2016 | $1,943 | $79,075 | $18,750 | $60,325 |
| 2015 | -- | $61,775 | $15,000 | $46,775 |
| 2014 | -- | $61,775 | $15,000 | $46,775 |
Source: Public Records
Map
Nearby Homes
- 3126 Tristan Dr
- 3121 Traviston Dr
- 3141 Tristan Dr
- 8037 Keats St
- 7181 Bolton St
- 7157 Bolton St
- 7151 Bolton St
- 7133 Bolton St
- 7127 Bolton St
- 7109 Bolton St
- 3127 Langley Dr
- 9008 Keats St
- 5079 Donovan St
- 5056 Donovan St
- 213 Fitzgerald St
- 2416 Nolen Ln
- 124 Fitzgerald St
- 5102 Donovan St
- 9080 Keats St
- 1132 Jewell Ave