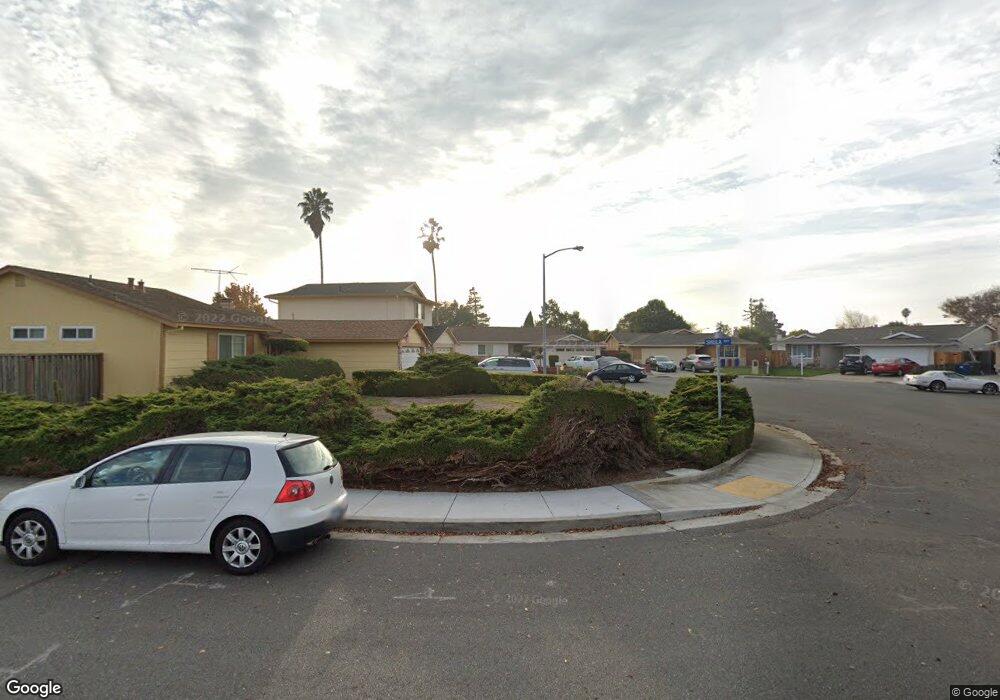
32518 Shiela Ct Union City, CA 94587
Alvarado NeighborhoodEstimated Value: $1,273,377 - $1,484,000
3
Beds
2
Baths
1,374
Sq Ft
$1,020/Sq Ft
Est. Value
About This Home
This home is located at 32518 Shiela Ct, Union City, CA 94587 and is currently estimated at $1,401,594, approximately $1,020 per square foot. 32518 Shiela Ct is a home located in Alameda County with nearby schools including Delaine Eastin Elementary School, Itliong-Vera Cruz, and James Logan High School.
Ownership History
Date
Name
Owned For
Owner Type
Purchase Details
Closed on
Jun 4, 2012
Sold by
Senander Maria Ines
Bought by
Senander Mathew L and Senander Maria Ines
Current Estimated Value
Purchase Details
Closed on
May 7, 2007
Sold by
Risso Maria Ines
Bought by
Risso Maria Ines and The Risso Family Revocable Liv
Purchase Details
Closed on
Feb 2, 2007
Sold by
Risso Maria Ines and Risso Family Revocable Living
Bought by
Risso William and Risso Maria Ines
Home Financials for this Owner
Home Financials are based on the most recent Mortgage that was taken out on this home.
Original Mortgage
$150,000
Interest Rate
6.19%
Mortgage Type
Credit Line Revolving
Purchase Details
Closed on
Dec 3, 1996
Sold by
Risso Antonio F and Risso Maria I
Bought by
Risso Antonio F and Risso Maria Ines
Create a Home Valuation Report for This Property
The Home Valuation Report is an in-depth analysis detailing your home's value as well as a comparison with similar homes in the area
Home Values in the Area
Average Home Value in this Area
Purchase History
| Date | Buyer | Sale Price | Title Company |
|---|---|---|---|
| Senander Mathew L | -- | None Available | |
| Risso Maria Ines | -- | None Available | |
| Risso Maria Ines | -- | None Available | |
| Risso William | $150,000 | First American Title Lenders | |
| Risso Antonio F | -- | -- | |
| Risso Antonio F | -- | -- |
Source: Public Records
Mortgage History
| Date | Status | Borrower | Loan Amount |
|---|---|---|---|
| Previous Owner | Risso William | $150,000 |
Source: Public Records
Tax History Compared to Growth
Tax History
| Year | Tax Paid | Tax Assessment Tax Assessment Total Assessment is a certain percentage of the fair market value that is determined by local assessors to be the total taxable value of land and additions on the property. | Land | Improvement |
|---|---|---|---|---|
| 2025 | $4,427 | $232,041 | $82,853 | $149,188 |
| 2024 | $4,427 | $227,491 | $81,228 | $146,263 |
| 2023 | $4,235 | $223,031 | $79,636 | $143,395 |
| 2022 | $4,132 | $218,659 | $78,075 | $140,584 |
| 2021 | $4,040 | $214,372 | $76,544 | $137,828 |
| 2020 | $4,000 | $212,174 | $75,759 | $136,415 |
| 2019 | $4,020 | $208,014 | $74,274 | $133,740 |
| 2018 | $3,923 | $203,937 | $72,818 | $131,119 |
| 2017 | $3,827 | $199,938 | $71,390 | $128,548 |
| 2016 | $3,693 | $196,018 | $69,991 | $126,027 |
| 2015 | $3,616 | $193,075 | $68,940 | $124,135 |
| 2014 | $3,481 | $189,293 | $67,589 | $121,704 |
Source: Public Records
Map
Nearby Homes
- 4639 Michelle Ct
- 4611 Carmen Way
- 32409 Elizabeth Way
- 4532 Delores Dr
- 32945 Regents Blvd
- 32451 Regents Blvd
- 33018 Soquel St
- 34102 Zaner Way
- 32447 Pacific Grove Way
- 4506 Birchwood Ct
- 33064 Compton Ct
- 4231 Hanford St
- 4201 Saturn Way
- 4214 Saturn Way
- 4243 Comet Cir
- 4272 Warbler Loop
- 4633 Granada Way
- 4475 Queen Anne Dr
- 4100 Aquarius Cir
- 4263 Queen Anne Dr
- 32520 Shiela Ct
- 32516 Shiela Ct
- 32519 Jacklynn Dr
- 32523 Jacklynn Dr
- 32515 Jacklynn Dr
- 32522 Shiela Ct
- 32527 Jacklynn Dr
- 32526 Shiela Way
- 32514 Shiela Ct
- 32514 Sheila Ct
- 32511 Jacklynn Dr
- 32531 Jacklynn Dr
- 32530 Shiela Way
- 32510 Shiela Ct
- 4736 Michelle Way
- 4732 Michelle Way
- 32535 Jacklynn Dr
- 4740 Michelle Way
- 4728 Michelle Way
- 32522 Jacklynn Dr