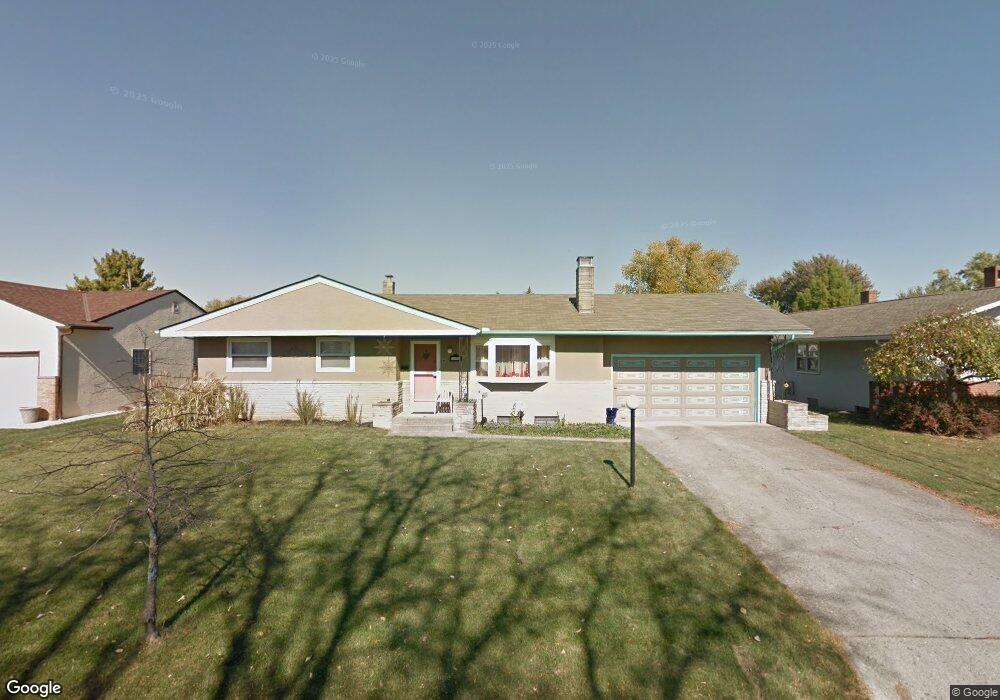
3252 Stephen Dr S Columbus, OH 43204
Southwest Hilltop NeighborhoodEstimated Value: $222,778 - $255,000
2
Beds
2
Baths
1,276
Sq Ft
$186/Sq Ft
Est. Value
About This Home
This home is located at 3252 Stephen Dr S, Columbus, OH 43204 and is currently estimated at $236,945, approximately $185 per square foot. 3252 Stephen Dr S is a home located in Franklin County with nearby schools including Binns Elementary School, Wedgewood Middle School, and Briggs High School.
Ownership History
Date
Name
Owned For
Owner Type
Purchase Details
Closed on
Dec 19, 2008
Sold by
Slaughter Peggy Lou Nell and The Louise Vane Nell Trust
Bought by
Melfi Patrick D
Current Estimated Value
Home Financials for this Owner
Home Financials are based on the most recent Mortgage that was taken out on this home.
Original Mortgage
$107,417
Outstanding Balance
$70,732
Interest Rate
6.06%
Mortgage Type
FHA
Estimated Equity
$166,213
Purchase Details
Closed on
Dec 17, 2008
Sold by
Wilson Patricia Catherine Nell and The Louise Vane Nell Trust
Bought by
Melfi Patrick D
Home Financials for this Owner
Home Financials are based on the most recent Mortgage that was taken out on this home.
Original Mortgage
$107,417
Outstanding Balance
$70,732
Interest Rate
6.06%
Mortgage Type
FHA
Estimated Equity
$166,213
Purchase Details
Closed on
May 12, 1997
Sold by
Vane Nell Louise V and Vane Louise
Bought by
Nell Louise Vane and Louise Vane Nell Trust
Purchase Details
Closed on
Apr 24, 1991
Purchase Details
Closed on
Apr 8, 1988
Create a Home Valuation Report for This Property
The Home Valuation Report is an in-depth analysis detailing your home's value as well as a comparison with similar homes in the area
Home Values in the Area
Average Home Value in this Area
Purchase History
| Date | Buyer | Sale Price | Title Company |
|---|---|---|---|
| Melfi Patrick D | $108,000 | Valmer Land | |
| Melfi Patrick D | $108,000 | Valmer Land | |
| Nell Louise Vane | -- | -- | |
| -- | $81,500 | -- | |
| -- | -- | -- |
Source: Public Records
Mortgage History
| Date | Status | Borrower | Loan Amount |
|---|---|---|---|
| Open | Melfi Patrick D | $107,417 | |
| Closed | Melfi Patrick D | $107,417 |
Source: Public Records
Tax History Compared to Growth
Tax History
| Year | Tax Paid | Tax Assessment Tax Assessment Total Assessment is a certain percentage of the fair market value that is determined by local assessors to be the total taxable value of land and additions on the property. | Land | Improvement |
|---|---|---|---|---|
| 2024 | $3,179 | $70,840 | $15,400 | $55,440 |
| 2023 | $3,139 | $70,840 | $15,400 | $55,440 |
| 2022 | $2,422 | $46,690 | $8,890 | $37,800 |
| 2021 | $2,426 | $46,690 | $8,890 | $37,800 |
| 2020 | $2,429 | $46,690 | $8,890 | $37,800 |
| 2019 | $2,338 | $38,540 | $7,420 | $31,120 |
| 2018 | $2,060 | $38,540 | $7,420 | $31,120 |
| 2017 | $2,337 | $38,540 | $7,420 | $31,120 |
| 2016 | $1,969 | $29,720 | $5,920 | $23,800 |
| 2015 | $1,787 | $29,720 | $5,920 | $23,800 |
| 2014 | $1,792 | $29,720 | $5,920 | $23,800 |
| 2013 | $1,040 | $34,965 | $6,965 | $28,000 |
Source: Public Records
Map
Nearby Homes
- 1027 S Brinker Ave
- 3318 Miriam Dr S
- 3360 Briggs Rd
- 840 Mark Place
- 1181 Onslow Dr
- 1226 Pinnacle Dr
- 1037 Chestershire Rd
- 894 Binns Blvd
- 3029 Rosedale Ave
- 890 S Roys Ave
- 1243 Trevor Ct
- 737 S Brinker Ave
- 828 Binns Blvd
- 781 Stephen Dr W
- 793 Binns Blvd
- 898 Chestershire Rd
- 3551 Glorious Rd
- 814 Chestershire Rd
- 725 Binns Blvd
- 2929 Briggs Rd
- 3260 S Stephens Dr
- 3260 Stephen Dr S
- 3246 Stephen Dr S
- 3243 Miriam Dr S
- 3251 Miriam Dr S
- 3234 Stephen Dr S
- 3235 Miriam Dr S
- 3272 Stephen Dr S
- 3259 Stephen Dr S
- 3251 Stephen Dr S
- 998 S Brinker Ave
- 3267 Stephen Dr S
- 3243 Stephen Dr S
- 3261 Miriam Dr S
- 3277 Stephen Dr S
- 3233 Stephen Dr S
- 986 Miriam Dr E
- 1023 Anthony Dr
- 3222 Stephen Dr S
- 1015 Anthony Dr