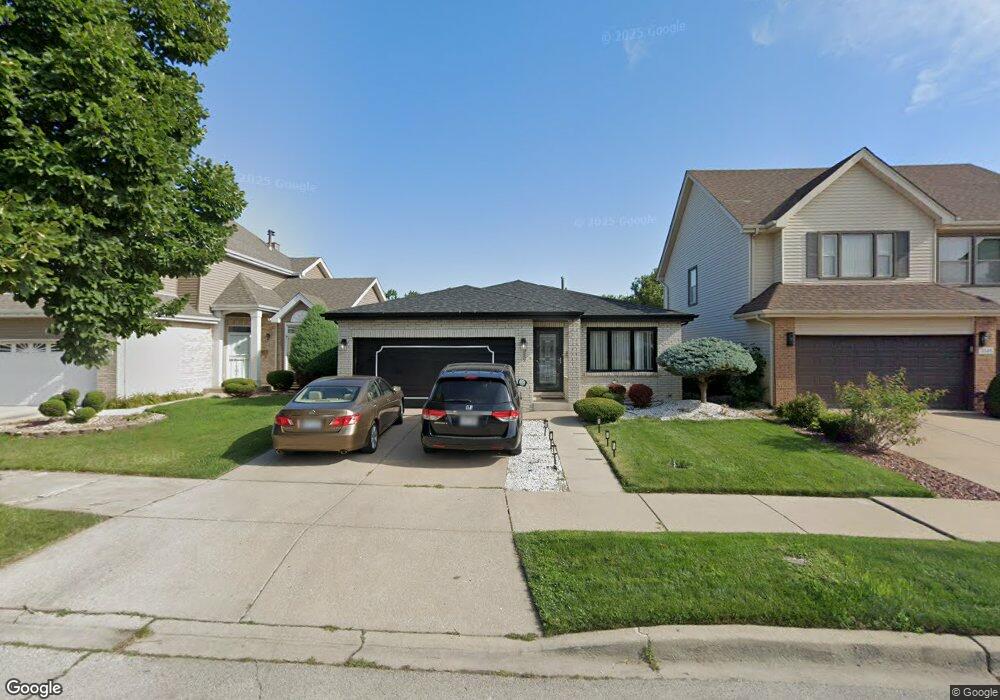
3252 W 85th Place Chicago, IL 60652
Ashburn NeighborhoodEstimated Value: $318,000 - $400,000
3
Beds
3
Baths
1,431
Sq Ft
$242/Sq Ft
Est. Value
About This Home
This home is located at 3252 W 85th Place, Chicago, IL 60652 and is currently estimated at $345,760, approximately $241 per square foot. 3252 W 85th Place is a home located in Cook County with nearby schools including Carroll-Rosenwald Elementary School - Carroll Campus, Bogan Computer Technical High School, and CICS - Wrightwood.
Ownership History
Date
Name
Owned For
Owner Type
Purchase Details
Closed on
Oct 14, 2010
Sold by
Chapman Bennie Edward
Bought by
Stanford Vashea L
Current Estimated Value
Purchase Details
Closed on
Dec 31, 2009
Sold by
Chapman Bennie E and Chapman Elaine
Bought by
Champman Bennie E and Chapman Elaine
Purchase Details
Closed on
Nov 24, 1997
Sold by
Chapman Bennie and Chapman Elaine
Bought by
Chapman Bennie E
Purchase Details
Closed on
Jun 20, 1994
Sold by
Chicago Title & Trust Company
Bought by
Chapman Bennie E and Chapman Elaine
Home Financials for this Owner
Home Financials are based on the most recent Mortgage that was taken out on this home.
Original Mortgage
$161,600
Interest Rate
7.37%
Purchase Details
Closed on
Dec 21, 1993
Sold by
Worth Bank & Trust
Bought by
Marycrest Construction Co
Home Financials for this Owner
Home Financials are based on the most recent Mortgage that was taken out on this home.
Original Mortgage
$175,000
Interest Rate
7.26%
Create a Home Valuation Report for This Property
The Home Valuation Report is an in-depth analysis detailing your home's value as well as a comparison with similar homes in the area
Home Values in the Area
Average Home Value in this Area
Purchase History
| Date | Buyer | Sale Price | Title Company |
|---|---|---|---|
| Stanford Vashea L | $150,000 | None Available | |
| Champman Bennie E | -- | None Available | |
| Chapman Bennie E | -- | Advantage Title Company | |
| Chapman Bennie E | $202,000 | -- | |
| Marycrest Construction Co | $116,666 | -- |
Source: Public Records
Mortgage History
| Date | Status | Borrower | Loan Amount |
|---|---|---|---|
| Previous Owner | Chapman Bennie E | $161,600 | |
| Previous Owner | Marycrest Construction Co | $175,000 |
Source: Public Records
Tax History Compared to Growth
Tax History
| Year | Tax Paid | Tax Assessment Tax Assessment Total Assessment is a certain percentage of the fair market value that is determined by local assessors to be the total taxable value of land and additions on the property. | Land | Improvement |
|---|---|---|---|---|
| 2024 | $4,226 | $30,000 | $3,080 | $26,920 |
| 2023 | $1,867 | $26,000 | $4,106 | $21,894 |
| 2022 | $1,867 | $26,000 | $4,106 | $21,894 |
| 2021 | $1,777 | $25,999 | $4,106 | $21,893 |
| 2020 | $1,834 | $23,378 | $4,106 | $19,272 |
| 2019 | $1,829 | $25,976 | $4,106 | $21,870 |
| 2018 | $1,801 | $25,976 | $4,106 | $21,870 |
| 2017 | $3,240 | $22,331 | $3,593 | $18,738 |
| 2016 | $4,473 | $22,331 | $3,593 | $18,738 |
| 2015 | $2,234 | $22,331 | $3,593 | $18,738 |
| 2014 | $2,215 | $20,876 | $3,336 | $17,540 |
| 2013 | $2,223 | $20,876 | $3,336 | $17,540 |
Source: Public Records
Map
Nearby Homes
- 3101 W 87th St
- 3237 W 83rd Place
- 8738 S Troy Ave
- 3158 W 88th St Unit 103
- 3030 W 85th St
- 3442 W 84th St
- 8753 S Troy Ave
- 3011 W 87th St
- 8821 S Troy Ave
- 8223 S Sawyer Ave
- 8701 S Sacramento Ave Unit 2NW
- 8242 S Albany Ave
- 8834 S Albany Ave
- 8230 S Albany Ave
- 3614 W 86th Place
- 3630 W 86th Place
- 3631 W 86th Place
- 8841 S Utica Ave
- 8118 S Spaulding Ave
- 8825 S Richmond Ave
- 3248 W 85th Place
- 3262 W 85th Place
- 3244 W 85th Place
- 3253 W 85th St
- 3257 W 85th St
- 3249 W 85th St
- 3302 W 85th Place
- 3240 W 85th Place
- 3261 W 85th St
- 3245 W 85th St
- 3255 W 85th Place
- 3306 W 85th Place
- 3236 W 85th Place
- 3241 W 85th St
- 3251 W 85th Place
- 3261 W 85th Place
- 8532 S Sawyer Ave
- 3303 W 85th St
- 3265 W 85th Place