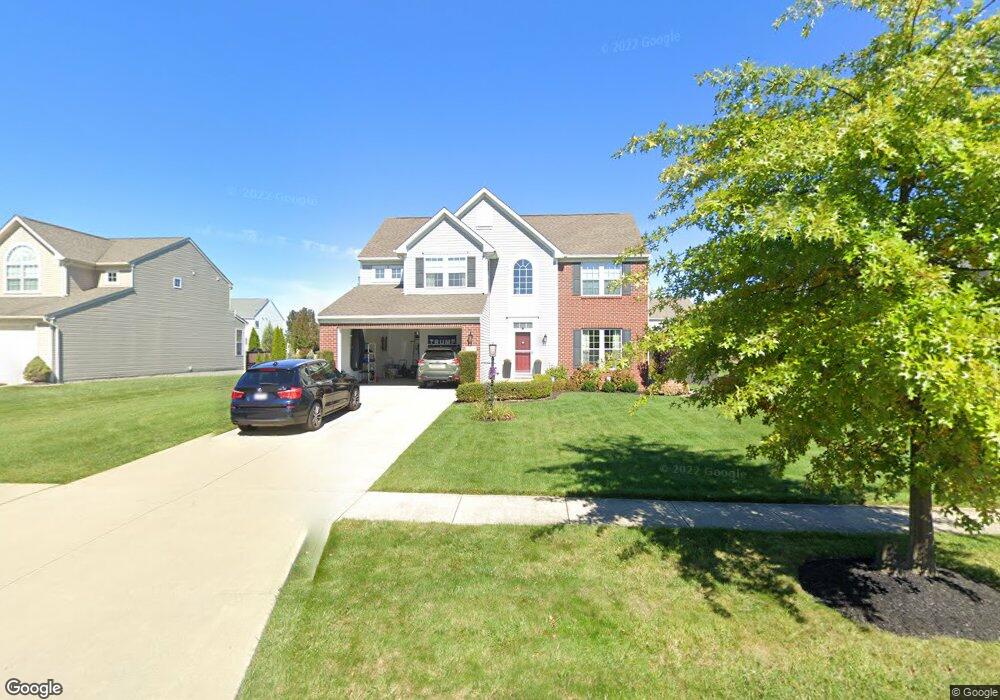
3253 Burnham Dr Brunswick, OH 44212
Estimated Value: $431,294 - $553,000
4
Beds
3
Baths
2,982
Sq Ft
$166/Sq Ft
Est. Value
About This Home
This home is located at 3253 Burnham Dr, Brunswick, OH 44212 and is currently estimated at $493,824, approximately $165 per square foot. 3253 Burnham Dr is a home located in Medina County with nearby schools including Crestview Elementary School, Willets Middle School, and Brunswick High School.
Ownership History
Date
Name
Owned For
Owner Type
Purchase Details
Closed on
Aug 30, 2011
Sold by
Nvr Inc Dba Ryan Homes
Bought by
Ross Willis and Barba-Willis Carolina
Current Estimated Value
Home Financials for this Owner
Home Financials are based on the most recent Mortgage that was taken out on this home.
Original Mortgage
$280,074
Outstanding Balance
$194,789
Interest Rate
4.59%
Mortgage Type
VA
Estimated Equity
$299,035
Purchase Details
Closed on
Jul 7, 2011
Sold by
Nvr Inc
Bought by
Willis Ross and Barba-Willis Carolina
Home Financials for this Owner
Home Financials are based on the most recent Mortgage that was taken out on this home.
Original Mortgage
$280,074
Outstanding Balance
$194,789
Interest Rate
4.59%
Mortgage Type
VA
Estimated Equity
$299,035
Purchase Details
Closed on
Jun 8, 2011
Sold by
Knight Development Corp
Bought by
Nvr Inc Dba Ryan Homes
Home Financials for this Owner
Home Financials are based on the most recent Mortgage that was taken out on this home.
Original Mortgage
$280,074
Interest Rate
4.59%
Mortgage Type
VA
Create a Home Valuation Report for This Property
The Home Valuation Report is an in-depth analysis detailing your home's value as well as a comparison with similar homes in the area
Home Values in the Area
Average Home Value in this Area
Purchase History
| Date | Buyer | Sale Price | Title Company |
|---|---|---|---|
| Ross Willis | $274,180 | -- | |
| Willis Ross | -- | Nvr Title Agency, Llc | |
| Nvr Inc Dba Ryan Homes | $58,000 | -- |
Source: Public Records
Mortgage History
| Date | Status | Borrower | Loan Amount |
|---|---|---|---|
| Open | Ross Willis | $280,074 | |
| Previous Owner | Willis Ross | $280,074 |
Source: Public Records
Tax History Compared to Growth
Tax History
| Year | Tax Paid | Tax Assessment Tax Assessment Total Assessment is a certain percentage of the fair market value that is determined by local assessors to be the total taxable value of land and additions on the property. | Land | Improvement |
|---|---|---|---|---|
| 2024 | $5,137 | $120,340 | $23,810 | $96,530 |
| 2023 | $5,137 | $120,340 | $23,810 | $96,530 |
| 2022 | $5,405 | $120,340 | $23,810 | $96,530 |
| 2021 | $4,123 | $95,520 | $18,900 | $76,620 |
| 2020 | $3,670 | $95,520 | $18,900 | $76,620 |
| 2019 | $4,769 | $95,520 | $18,900 | $76,620 |
| 2018 | $4,305 | $82,380 | $18,390 | $63,990 |
| 2017 | $3,948 | $82,380 | $18,390 | $63,990 |
| 2016 | $3,820 | $82,380 | $18,390 | $63,990 |
| 2015 | $3,726 | $77,720 | $17,350 | $60,370 |
| 2014 | $3,650 | $77,720 | $17,350 | $60,370 |
| 2013 | $3,844 | $77,720 | $17,350 | $60,370 |
Source: Public Records
Map
Nearby Homes
- 3137 Blackburn Ln
- 3125 Portsmouth Dr
- 15188 Trails Landing
- 19740 Benbow Rd
- 3003 Alda Pkwy
- 15604-REAR Boston Rd
- 106 Briarleigh Dr
- 19694 Benbow Rd
- 15772 Boston Rd
- 19813 Cross Trail S
- 97 Weathervane Ln
- 3113 Briarcliff Dr
- 266 Bettie Ln
- 3041 Portsmouth Dr
- 3243 Broadleaf Way
- 14985 Camden Cir
- 2882 Marion Pkwy
- 3495 Grafton Rd
- 18987 Laurell Cir
- 356 Lakewood Ave
- 3245 Burnham Dr
- 3261 Burnham Dr
- 3237 Burnham Dr
- 3260 Hartwick Cir
- 3244 Hartwick Cir
- 3254 Burnham Dr
- 3269 Burnham Dr
- 3269 Burnham Dr Unit 56
- 3252 Hartwick Cir
- 3252 Hartwick Cir Unit 27
- 3246 Burnham Dr
- 3262 Burnham Dr
- 3270 Hartwick Cir
- 3227 Burnham Dr
- 3268 Burnham Dr
- 3236 Hartwick Cir
- 3238 Burnham Dr
- 3226 Hartwick Cir
- 3219 Burnham Dr
- 3228 Burnham Dr