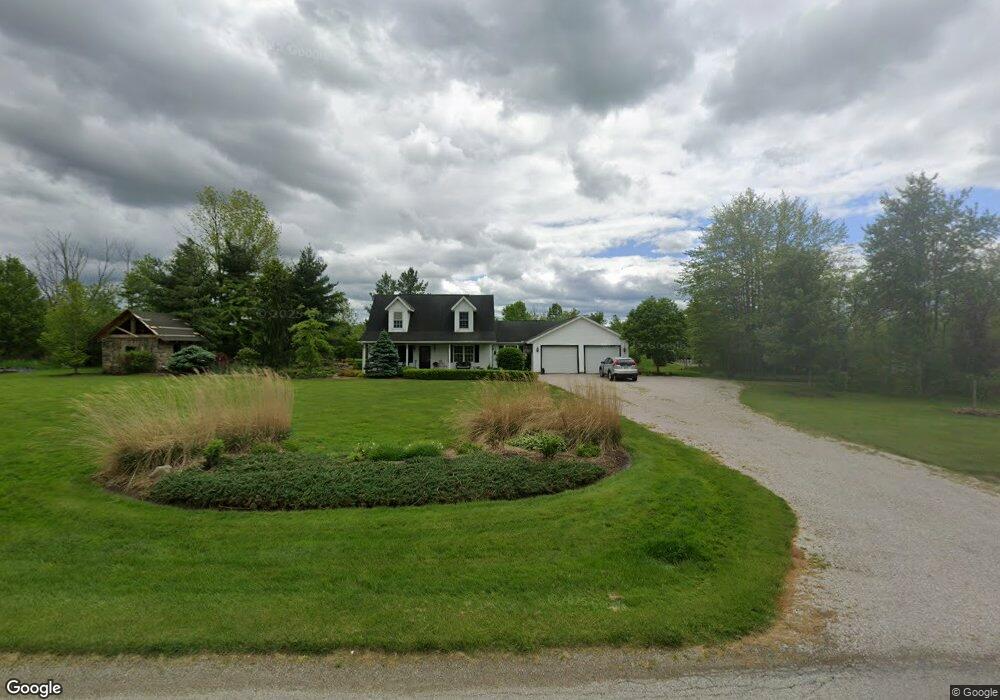
3254 Callender Rd Rock Creek, OH 44084
Estimated Value: $244,000 - $317,000
3
Beds
2
Baths
1,394
Sq Ft
$200/Sq Ft
Est. Value
About This Home
This home is located at 3254 Callender Rd, Rock Creek, OH 44084 and is currently estimated at $278,598, approximately $199 per square foot. 3254 Callender Rd is a home located in Ashtabula County with nearby schools including Grand Valley Elementary School, Grand Valley Middle School, and Grand Valley High School.
Ownership History
Date
Name
Owned For
Owner Type
Purchase Details
Closed on
Jul 9, 2015
Sold by
Baker Paul and Baker Rochelle
Bought by
Ziegler Beth
Current Estimated Value
Purchase Details
Closed on
Sep 6, 2012
Sold by
Eland Eric J and Eland Wendy S
Bought by
Eland Wendy S and Eland Eric J
Purchase Details
Closed on
Apr 5, 1999
Sold by
Plemel Kenneth L
Bought by
Eland Eric and Eland Wendy S
Home Financials for this Owner
Home Financials are based on the most recent Mortgage that was taken out on this home.
Original Mortgage
$124,450
Interest Rate
6.89%
Mortgage Type
New Conventional
Purchase Details
Closed on
Feb 23, 1998
Sold by
Zarnick Ralph V
Bought by
Plemel Kenneth L
Purchase Details
Closed on
Oct 22, 1996
Sold by
Kuntz Properties Inc
Bought by
Zarnick Ralph V
Purchase Details
Closed on
May 31, 1995
Sold by
Raszkiewicz Richard J
Bought by
Kuntz Properties Inc
Create a Home Valuation Report for This Property
The Home Valuation Report is an in-depth analysis detailing your home's value as well as a comparison with similar homes in the area
Home Values in the Area
Average Home Value in this Area
Purchase History
| Date | Buyer | Sale Price | Title Company |
|---|---|---|---|
| Ziegler Beth | -- | Attorney | |
| Eland Wendy S | -- | -- | |
| Eland Eric | $131,000 | -- | |
| Plemel Kenneth L | $6,500 | -- | |
| Zarnick Ralph V | $8,900 | -- | |
| Kuntz Properties Inc | $72,500 | -- |
Source: Public Records
Mortgage History
| Date | Status | Borrower | Loan Amount |
|---|---|---|---|
| Previous Owner | Eland Eric | $124,450 |
Source: Public Records
Tax History Compared to Growth
Tax History
| Year | Tax Paid | Tax Assessment Tax Assessment Total Assessment is a certain percentage of the fair market value that is determined by local assessors to be the total taxable value of land and additions on the property. | Land | Improvement |
|---|---|---|---|---|
| 2024 | $5,034 | $68,190 | $14,180 | $54,010 |
| 2023 | $2,772 | $68,190 | $14,180 | $54,010 |
| 2022 | $2,337 | $50,900 | $10,890 | $40,010 |
| 2021 | $2,321 | $50,900 | $10,890 | $40,010 |
| 2020 | $2,214 | $50,900 | $10,890 | $40,010 |
| 2019 | $2,413 | $53,310 | $11,380 | $41,930 |
| 2018 | $2,311 | $53,310 | $11,380 | $41,930 |
| 2017 | $2,214 | $53,310 | $11,380 | $41,930 |
| 2016 | $2,149 | $46,980 | $10,050 | $36,930 |
| 2015 | $2,118 | $46,980 | $10,050 | $36,930 |
| 2014 | $2,055 | $46,980 | $10,050 | $36,930 |
| 2013 | $1,922 | $42,880 | $5,250 | $37,630 |
Source: Public Records
Map
Nearby Homes
- 2891 Callender Rd
- 4772 Ohio 45
- 640 Oriole Dr
- 748 Rome Rock Creek Rd
- 519 Rome Rock Creek Rd
- 683 Rome Rock Creek Rd
- 664 Wren Cir
- 681&682 Rome Rock Creek Rd
- 490 Peacock Ln
- 498 Eagle Point
- 62 Rockaway Dr
- 5252 State Route 45
- 3196 N Main St
- 2866 Jefferson St
- 3031 Logan Ln Unit 1
- 2488 Tupelo Dr
- 2514 Hayford Rd
- 2213 Fox Run Cir
- 0 US Route 6 Unit 5161661
- 2018 Flame Lake Dr
- 3282 Callender Rd
- 4237 State Route 45
- 4169 State Route 45 S
- 3180 Callender Rd
- 4269 State Route 45
- 4242 State Route 45
- 3322 Callender Rd
- 4309 State Route 45
- 3128 Callender Rd
- 4150 State Route 45 S
- 3372 Callender Rd
- 4338 State Route 45
- 4356 State Route 45
- 4365 State Route 45
- 4304 State Route 45
- 3100 Callender Rd
- 4071 State Route 45
- 4364 State Route 45
- 4078 State Route 45 S
- 3412 Callender Rd