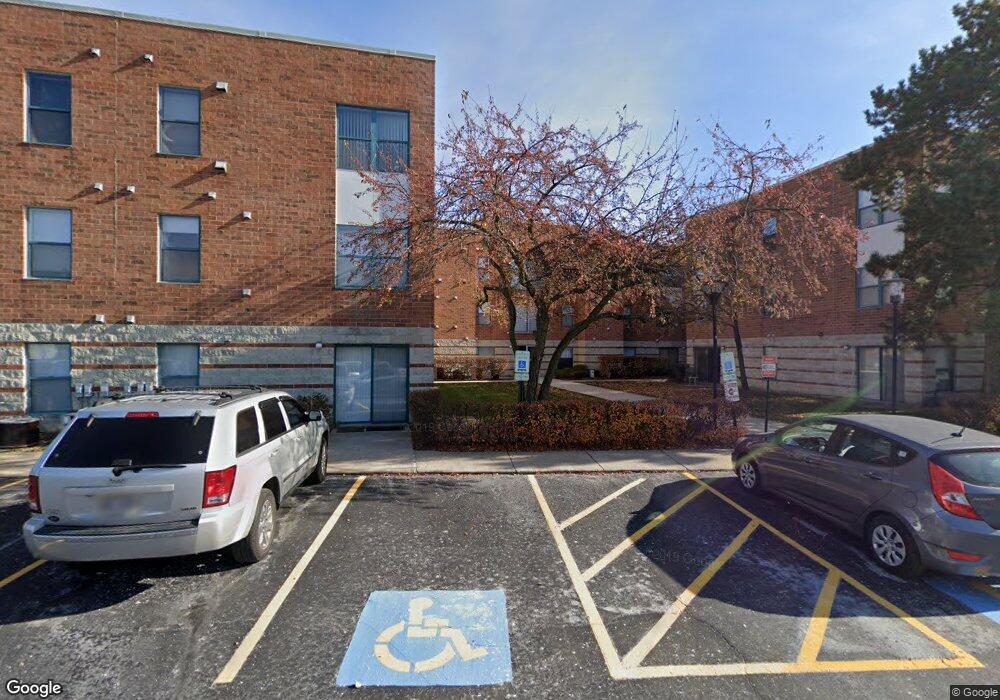
Kirchoff Meadows 3255 Kirchoff Rd Unit 101 Rolling Meadows, IL 60008
Estimated Value: $194,000 - $211,000
2
Beds
--
Bath
1,180
Sq Ft
$170/Sq Ft
Est. Value
About This Home
This home is located at 3255 Kirchoff Rd Unit 101, Rolling Meadows, IL 60008 and is currently estimated at $200,329, approximately $169 per square foot. 3255 Kirchoff Rd Unit 101 is a home located in Cook County with nearby schools including Kimball Hill Elementary School, Carl Sandburg Junior High School, and Rolling Meadows High School.
Ownership History
Date
Name
Owned For
Owner Type
Purchase Details
Closed on
Oct 13, 2017
Sold by
Loughlin Ann and Loughlin Bernard L
Bought by
Virmani Nizam
Current Estimated Value
Home Financials for this Owner
Home Financials are based on the most recent Mortgage that was taken out on this home.
Original Mortgage
$97,600
Outstanding Balance
$51,326
Interest Rate
3.78%
Mortgage Type
New Conventional
Estimated Equity
$149,003
Purchase Details
Closed on
Aug 17, 2002
Sold by
Khan Arshad and Khan Maimuna
Bought by
Perkolup Pamela and Edwards Brooke S
Home Financials for this Owner
Home Financials are based on the most recent Mortgage that was taken out on this home.
Original Mortgage
$119,500
Interest Rate
5.25%
Mortgage Type
Stand Alone First
Create a Home Valuation Report for This Property
The Home Valuation Report is an in-depth analysis detailing your home's value as well as a comparison with similar homes in the area
Home Values in the Area
Average Home Value in this Area
Purchase History
| Date | Buyer | Sale Price | Title Company |
|---|---|---|---|
| Virmani Nizam | $122,000 | Attorneys Title Guaranty Fun | |
| Perkolup Pamela | $129,500 | Lawyers Title Insurance Corp |
Source: Public Records
Mortgage History
| Date | Status | Borrower | Loan Amount |
|---|---|---|---|
| Open | Virmani Nizam | $97,600 | |
| Previous Owner | Perkolup Pamela | $119,500 |
Source: Public Records
Tax History
| Year | Tax Paid | Tax Assessment Tax Assessment Total Assessment is a certain percentage of the fair market value that is determined by local assessors to be the total taxable value of land and additions on the property. | Land | Improvement |
|---|---|---|---|---|
| 2025 | $3,907 | $18,991 | $1,113 | $17,878 |
| 2024 | $3,907 | $12,751 | $942 | $11,809 |
| 2023 | $3,742 | $12,751 | $942 | $11,809 |
| 2022 | $3,742 | $12,751 | $942 | $11,809 |
| 2021 | $2,985 | $9,015 | $556 | $8,459 |
| 2020 | $2,915 | $9,015 | $556 | $8,459 |
| 2019 | $2,938 | $10,099 | $556 | $9,543 |
| 2018 | $2,591 | $7,999 | $513 | $7,486 |
| 2017 | $2,538 | $7,999 | $513 | $7,486 |
| 2016 | $2,365 | $7,999 | $513 | $7,486 |
| 2015 | $2,354 | $7,475 | $470 | $7,005 |
| 2014 | $2,297 | $7,475 | $470 | $7,005 |
| 2013 | $2,360 | $7,868 | $470 | $7,398 |
Source: Public Records
About Kirchoff Meadows
Map
Nearby Homes
- 3265 Kirchoff Rd Unit 116
- 503 Lexington Ln
- 3135 Town Square Dr Unit 104
- 3135 Town Square Dr Unit 407
- 3008 Owl Dr
- 3100 Town Square Dr Unit 308
- 2814 Cardinal Dr
- 3502 Mallard Ct
- 3306 Trillium Cir Unit 3001
- 3200 Thrush Ln
- 3503 Bobolink Ln
- 2720 Lily Ln
- 2707 Lily Ln
- 3101 Thrush Ln
- 3610 Pheasant Dr
- 3806 Ashley Ct
- 399 Knollwood Ct
- 2503 George St
- 2401 Rohlwing Rd
- 2404 Hawk Ln
- 3265 Kirchoff Rd Unit 318
- 3265 Kirchoff Rd Unit 126
- 3265 Kirchoff Rd Unit 118
- 3255 Kirchoff Rd Unit 213
- 3265 Kirchoff Rd Unit 214
- 3265 Kirchoff Rd Unit 220
- 3265 Kirchoff Rd Unit 327
- 3265 Kirchoff Rd Unit 314
- 3255 Kirchoff Rd Unit 313
- 3265 Kirchoff Rd Unit 316
- 3265 Kirchoff Rd Unit 229
- 3265 Kirchoff Rd Unit 225
- 3265 Kirchoff Rd Unit 218
- 3255 Kirchoff Rd Unit 205
- 3265 Kirchoff Rd Unit 122
- 3255 Kirchoff Rd Unit 105
- 3265 Kirchoff Rd Unit 228
- 3255 Kirchoff Rd Unit 112
- 3265 Kirchoff Rd Unit 224
- 3255 Kirchoff Rd Unit 208
Your Personal Tour Guide
Ask me questions while you tour the home.