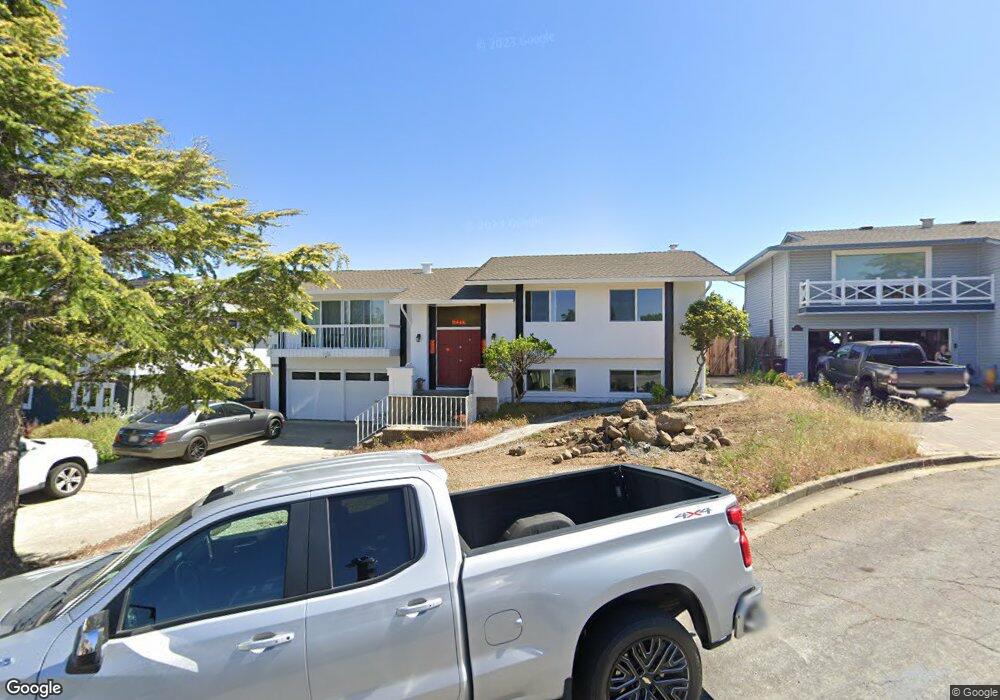
3255 Waterview Ct Hayward, CA 94542
Hayward Highland NeighborhoodEstimated Value: $1,401,262 - $1,510,000
4
Beds
3
Baths
2,294
Sq Ft
$634/Sq Ft
Est. Value
About This Home
This home is located at 3255 Waterview Ct, Hayward, CA 94542 and is currently estimated at $1,454,316, approximately $633 per square foot. 3255 Waterview Ct is a home located in Alameda County with nearby schools including Stonebrae Elementary School, Bret Harte Middle School, and Hayward High School.
Ownership History
Date
Name
Owned For
Owner Type
Purchase Details
Closed on
Mar 24, 2021
Sold by
Jennings Connie and Dirickson Michael Brian
Bought by
Dirickson Michael Brian and Liu Cynthia Chun
Current Estimated Value
Home Financials for this Owner
Home Financials are based on the most recent Mortgage that was taken out on this home.
Original Mortgage
$586,009
Outstanding Balance
$526,202
Interest Rate
2.8%
Mortgage Type
New Conventional
Estimated Equity
$928,114
Purchase Details
Closed on
Aug 5, 2016
Sold by
Dirickson Michael Eugene
Bought by
Jennings Connie
Home Financials for this Owner
Home Financials are based on the most recent Mortgage that was taken out on this home.
Original Mortgage
$625,500
Interest Rate
3.48%
Mortgage Type
New Conventional
Purchase Details
Closed on
Aug 1, 2016
Sold by
Goodwin Adele S and Wellington Peter S
Bought by
Jennings Connie and Dirickson Michael B
Home Financials for this Owner
Home Financials are based on the most recent Mortgage that was taken out on this home.
Original Mortgage
$625,500
Interest Rate
3.48%
Mortgage Type
New Conventional
Create a Home Valuation Report for This Property
The Home Valuation Report is an in-depth analysis detailing your home's value as well as a comparison with similar homes in the area
Home Values in the Area
Average Home Value in this Area
Purchase History
| Date | Buyer | Sale Price | Title Company |
|---|---|---|---|
| Dirickson Michael Brian | -- | Old Republic Title Company | |
| Jennings Connie | -- | Fidelity National Title Co | |
| Jennings Connie | $805,000 | Fidelity National Title Co |
Source: Public Records
Mortgage History
| Date | Status | Borrower | Loan Amount |
|---|---|---|---|
| Open | Dirickson Michael Brian | $586,009 | |
| Closed | Jennings Connie | $625,500 |
Source: Public Records
Tax History Compared to Growth
Tax History
| Year | Tax Paid | Tax Assessment Tax Assessment Total Assessment is a certain percentage of the fair market value that is determined by local assessors to be the total taxable value of land and additions on the property. | Land | Improvement |
|---|---|---|---|---|
| 2025 | $12,944 | $1,082,516 | $326,855 | $762,661 |
| 2024 | $12,944 | $1,061,157 | $320,447 | $747,710 |
| 2023 | $12,765 | $1,047,218 | $314,165 | $733,053 |
| 2022 | $10,839 | $1,021,085 | $308,005 | $718,680 |
| 2021 | $10,752 | $863,112 | $258,933 | $604,179 |
| 2020 | $10,631 | $854,265 | $256,279 | $597,986 |
| 2019 | $10,721 | $837,521 | $251,256 | $586,265 |
| 2018 | $10,047 | $821,100 | $246,330 | $574,770 |
| 2017 | $9,810 | $805,000 | $241,500 | $563,500 |
| 2016 | $2,027 | $157,265 | $57,133 | $100,132 |
| 2015 | $1,990 | $154,902 | $56,274 | $98,628 |
| 2014 | $1,899 | $151,868 | $55,172 | $96,696 |
Source: Public Records
Map
Nearby Homes
- 27956 Edgecliff Way
- 0 Parkside Dr
- 0 Hayward Blvd Unit 41103610
- 2757 Gamble Ct
- 27912 Farm Hill Dr
- 27050 Vista Bahia Way
- 26983 Hayward Blvd
- 27449 Dobbel Ave
- 26953 Hayward Blvd Unit 105
- 26937 Hayward Blvd Unit 217
- 26918 Claiborne Ct
- 26660 Hayward Blvd
- 2703 Tribune Ave
- 3621 La Mesa Dr
- 26550 Hayward Blvd
- 26373 Parkside Dr
- 3393 Oakes Dr
- 2437 Saint Helena Dr Unit 3
- 2419 Saint Helena Dr Unit 6
- 25912 Hayward Blvd Unit 204
- 3257 Waterview Ct
- 3247 Waterview Ct
- 27967 Edgecliff Way
- 27971 Edgecliff Way
- 3243 Waterview Ct
- 3261 Waterview Ct
- 27963 Edgecliff Way
- 3258 Waterview Ct
- 3246 Waterview Ct
- 3260 Waterview Ct
- 27975 Edgecliff Way
- 3254 Waterview Ct
- 3265 Round Hill Dr
- 27191 Columbia Way
- 27972 Edgecliff Way
- 27195 Columbia Way
- 27979 Edgecliff Way
- 3241 Harvest Ct
- 3245 Harvest Ct
- 27183 Columbia Way