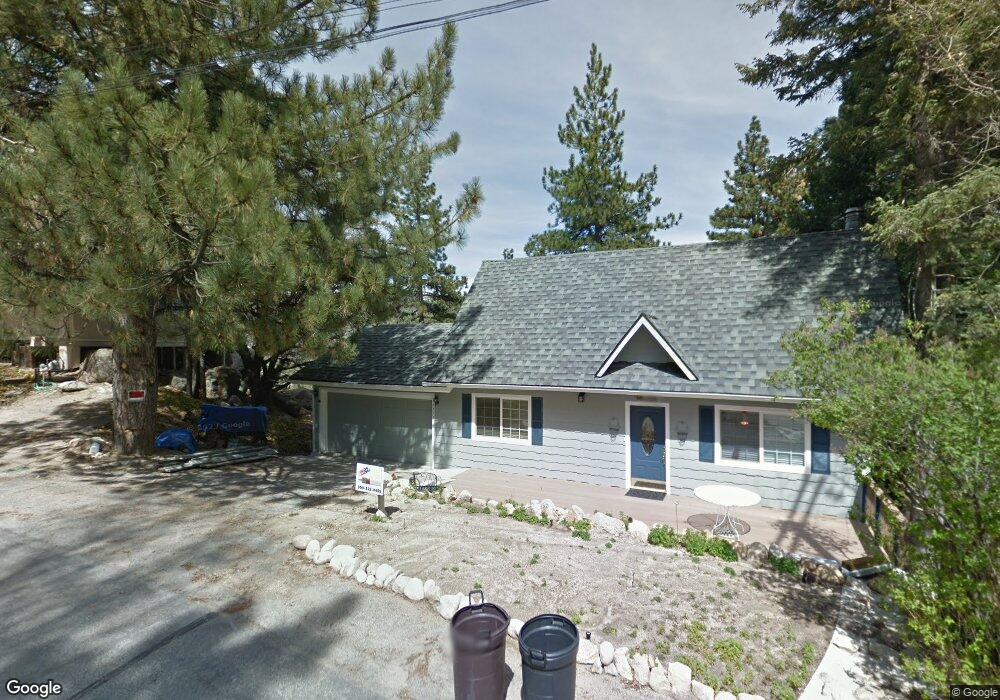
32555 Scandia Dr Running Springs, CA 92382
Estimated Value: $372,112 - $538,000
3
Beds
2
Baths
1,353
Sq Ft
$344/Sq Ft
Est. Value
About This Home
This home is located at 32555 Scandia Dr, Running Springs, CA 92382 and is currently estimated at $466,028, approximately $344 per square foot. 32555 Scandia Dr is a home located in San Bernardino County with nearby schools including Charles Hoffman Elementary School, Mary P. Henck Intermediate School, and Rim Of The World Senior High School.
Ownership History
Date
Name
Owned For
Owner Type
Purchase Details
Closed on
Oct 31, 2011
Sold by
Obrien Patrick and Obrien Debra
Bought by
Lambert Jeffrey P and Crider Kimberly A
Current Estimated Value
Home Financials for this Owner
Home Financials are based on the most recent Mortgage that was taken out on this home.
Original Mortgage
$127,920
Outstanding Balance
$86,891
Interest Rate
3.94%
Mortgage Type
New Conventional
Estimated Equity
$379,137
Purchase Details
Closed on
Jul 20, 2007
Sold by
Obrien Patrick M and Obrien Debra A
Bought by
Obrien Patrick and Obrien Debra
Home Financials for this Owner
Home Financials are based on the most recent Mortgage that was taken out on this home.
Original Mortgage
$288,000
Interest Rate
6.73%
Mortgage Type
New Conventional
Purchase Details
Closed on
May 1, 2000
Sold by
Napjus George A
Bought by
Obrien Patrick M and Obrien Debra A
Home Financials for this Owner
Home Financials are based on the most recent Mortgage that was taken out on this home.
Original Mortgage
$143,043
Interest Rate
8.22%
Mortgage Type
FHA
Create a Home Valuation Report for This Property
The Home Valuation Report is an in-depth analysis detailing your home's value as well as a comparison with similar homes in the area
Home Values in the Area
Average Home Value in this Area
Purchase History
| Date | Buyer | Sale Price | Title Company |
|---|---|---|---|
| Lambert Jeffrey P | $160,000 | First American Title Company | |
| Obrien Patrick | -- | Fidelity National Title Co | |
| Obrien Patrick M | $144,000 | Commonwealth Land Title Co |
Source: Public Records
Mortgage History
| Date | Status | Borrower | Loan Amount |
|---|---|---|---|
| Open | Lambert Jeffrey P | $127,920 | |
| Previous Owner | Obrien Patrick | $288,000 | |
| Previous Owner | Obrien Patrick M | $143,043 |
Source: Public Records
Tax History Compared to Growth
Tax History
| Year | Tax Paid | Tax Assessment Tax Assessment Total Assessment is a certain percentage of the fair market value that is determined by local assessors to be the total taxable value of land and additions on the property. | Land | Improvement |
|---|---|---|---|---|
| 2025 | $2,596 | $200,846 | $24,101 | $176,745 |
| 2024 | $2,596 | $196,907 | $23,628 | $173,279 |
| 2023 | $2,568 | $193,046 | $23,165 | $169,881 |
| 2022 | $2,521 | $189,261 | $22,711 | $166,550 |
| 2021 | $2,495 | $185,550 | $22,266 | $163,284 |
| 2020 | $2,495 | $183,648 | $22,038 | $161,610 |
| 2019 | $2,435 | $180,047 | $21,606 | $158,441 |
| 2018 | $2,306 | $176,516 | $21,182 | $155,334 |
| 2017 | $2,266 | $173,055 | $20,767 | $152,288 |
| 2016 | $2,201 | $169,662 | $20,360 | $149,302 |
| 2015 | $2,179 | $167,113 | $20,054 | $147,059 |
| 2014 | $2,145 | $163,839 | $19,661 | $144,178 |
Source: Public Records
Map
Nearby Homes
- 32538 Scandia Dr
- 32490 Scandia Dr
- 0 Cobblestone Ln Unit IG24253088
- 2686 Viking Ln
- 32455 Scandia Dr
- 32703 Tulip Ln
- 32773 Evergreen Ln
- 32296 Fern Dr
- 32765 Cougar Ln
- 32796 Lupine Ln
- 22 Deer Lick Dr
- 000 Deer Lick Dr
- 00 Deer Lick Dr
- 32311 Fern Dr
- 0 Deer Lick Dr Unit OC25165223
- 1 Deer Lick Dr
- 32825 Deer Lick Dr
- 0 Tulip Ln
- 0 Encina Dr Unit IG24219614
- 32780 Cougar Ln
- 32561 Scandia Dr
- 32541 Scandia Dr
- 32560 Scandia Dr
- 32535 Scandia Dr
- 32548 Scandia Dr
- 32571 Scandia Dr
- 32575 Scandia Dr
- 2601 Thule Ln
- 32530 Scandia Dr
- 2615 Thule Ln
- 32531 Scandia Dr
- 32580 Scandia Dr
- 2625 Thule Ln
- 32526 Scandia Dr
- 32585 Scandia Dr
- 32525 Scandia Dr
- 2645 Thule Ln
- 2610 Thule Ln
- 2635 Thule Ln
- 2575 Valkyrie Dr