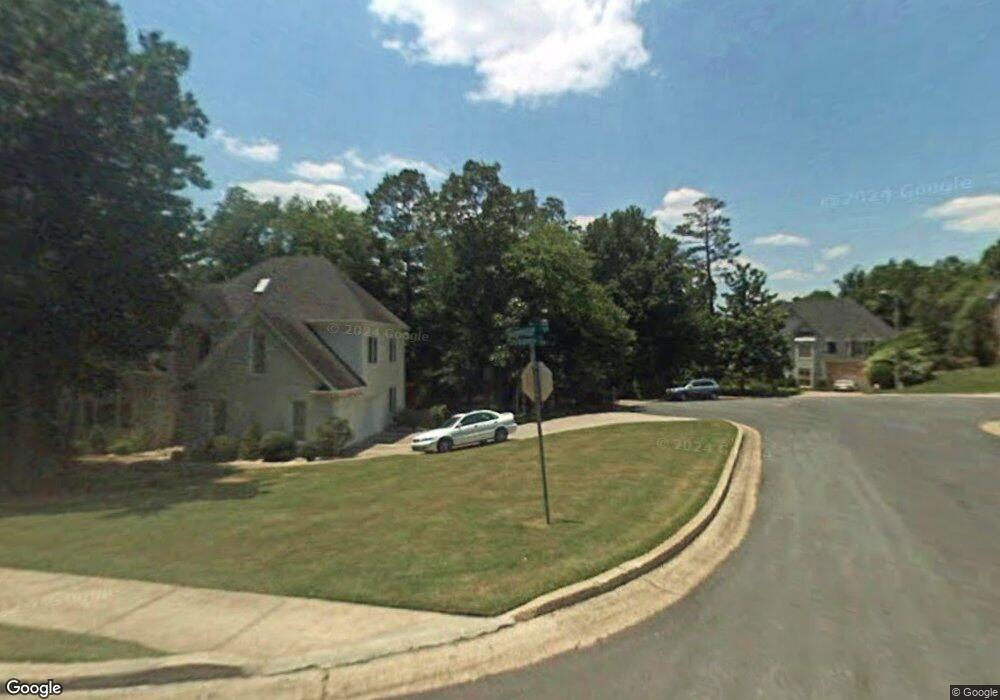
3257 Highborne Ct NE Unit 3 Marietta, GA 30066
Sandy Plains NeighborhoodEstimated Value: $740,000 - $853,986
5
Beds
5
Baths
3,151
Sq Ft
$259/Sq Ft
Est. Value
About This Home
This home is located at 3257 Highborne Ct NE Unit 3, Marietta, GA 30066 and is currently estimated at $817,497, approximately $259 per square foot. 3257 Highborne Ct NE Unit 3 is a home located in Cobb County with nearby schools including Davis Elementary School, Mabry Middle School, and Lassiter High School.
Ownership History
Date
Name
Owned For
Owner Type
Purchase Details
Closed on
Sep 10, 2025
Sold by
Gonzalez Aleidra S and Gonzalez Jose J
Bought by
Aleidra And Jose Gonzalez Living Trust and Gonzalez
Current Estimated Value
Purchase Details
Closed on
Apr 19, 2007
Sold by
Zalewski Lina M and Zalewski Philip S
Bought by
Gonzalez Aleidra S and Gonzalez Jose J
Home Financials for this Owner
Home Financials are based on the most recent Mortgage that was taken out on this home.
Original Mortgage
$302,000
Interest Rate
6.1%
Mortgage Type
New Conventional
Purchase Details
Closed on
Jun 14, 2002
Sold by
Corey Stephen A and Corey Bobbie A
Bought by
Zalewski Lina M and Zalewski Philip S
Home Financials for this Owner
Home Financials are based on the most recent Mortgage that was taken out on this home.
Original Mortgage
$234,400
Interest Rate
4%
Mortgage Type
New Conventional
Create a Home Valuation Report for This Property
The Home Valuation Report is an in-depth analysis detailing your home's value as well as a comparison with similar homes in the area
Home Values in the Area
Average Home Value in this Area
Purchase History
| Date | Buyer | Sale Price | Title Company |
|---|---|---|---|
| Aleidra And Jose Gonzalez Living Trust | -- | None Listed On Document | |
| Gonzalez Aleidra S | $325,000 | -- | |
| Zalewski Lina M | $293,000 | -- |
Source: Public Records
Mortgage History
| Date | Status | Borrower | Loan Amount |
|---|---|---|---|
| Previous Owner | Gonzalez Aleidra S | $302,000 | |
| Previous Owner | Zalewski Lina M | $234,400 |
Source: Public Records
Tax History Compared to Growth
Tax History
| Year | Tax Paid | Tax Assessment Tax Assessment Total Assessment is a certain percentage of the fair market value that is determined by local assessors to be the total taxable value of land and additions on the property. | Land | Improvement |
|---|---|---|---|---|
| 2025 | $7,231 | $291,960 | $64,000 | $227,960 |
| 2024 | $6,905 | $276,640 | $64,000 | $212,640 |
| 2023 | $6,019 | $260,796 | $50,000 | $210,796 |
| 2022 | $5,878 | $227,276 | $44,000 | $183,276 |
| 2021 | $4,905 | $182,844 | $38,000 | $144,844 |
| 2020 | $4,905 | $182,844 | $38,000 | $144,844 |
| 2019 | $4,905 | $182,844 | $38,000 | $144,844 |
| 2018 | $4,764 | $176,384 | $36,000 | $140,384 |
| 2017 | $4,562 | $176,384 | $36,000 | $140,384 |
| 2016 | $3,979 | $149,768 | $23,200 | $126,568 |
| 2015 | $4,075 | $149,768 | $23,200 | $126,568 |
| 2014 | $4,109 | $149,768 | $0 | $0 |
Source: Public Records
Map
Nearby Homes
- 3333 Devaughn Dr NE
- 4302 Highborne Dr NE Unit 3
- 4397 Windsor Oaks Cir
- 4219 N Mountain Rd NE
- 4563 Ashmore Cir NE
- 4243 N Mountain Rd NE
- 3043 Sawyer Trace NE
- 3350 Brookhill Cir
- 2855 Lamer Trace
- 3130 Maley Ct
- 4589 Wigley Estates Rd
- 4259 Arbor Club Dr
- 2713 Arbor Summit
- 4464 Windsor Oaks Dr
- 2842 Forest Chase Dr NE
- 3851 Timber Hollow Way
- 3480 Pebble Hill Dr
- 3238 Mountain Hollow Dr
- 3147 Swallow Dr NE
- 4380 Wood Creek Dr
- 3259 Highborne Ct NE Unit 3
- 3256 Highborne Ct NE Unit 3
- 4235 Highborne Dr NE Unit 3
- 3258 Highborne Ct NE
- 3340 Devaughn Dr NE
- 4239 Highborne Dr NE
- 4236 Highborne Dr NE
- 3342 Devaughn Dr NE
- 3338 Devaughn Dr NE
- 4233 Highborne Dr NE
- 0 Wigley Rd NE Unit 8670886
- 0 Wigley Rd NE Unit 7551993
- 0 Wigley Rd NE Unit 8840794
- 0 Wigley Rd NE
- 4350 Wigley Rd NE
- 3275 Highborne Cir NE Unit 3
- 4238 Highborne Dr NE
- 4241 Highborne Dr NE
- 0 Walking Stick Overlook Unit 8969512
- 3336 Devaughn Dr NE Unit 2