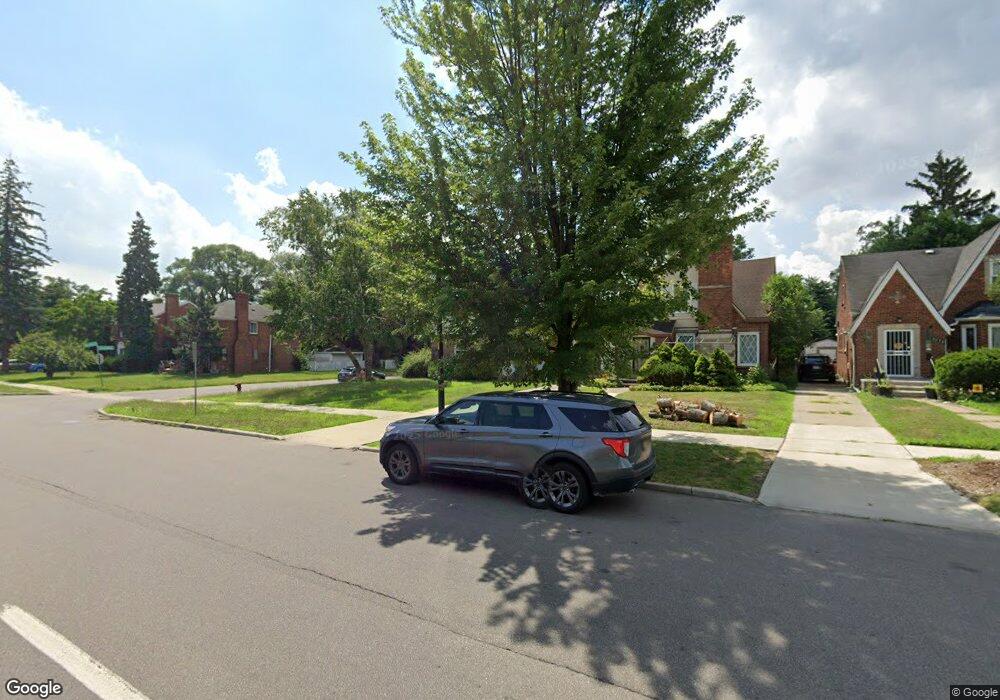
3257 W Outer Dr Detroit, MI 48221
Bagley NeighborhoodEstimated Value: $176,051 - $215,000
3
Beds
3
Baths
1,429
Sq Ft
$138/Sq Ft
Est. Value
About This Home
This home is located at 3257 W Outer Dr, Detroit, MI 48221 and is currently estimated at $197,263, approximately $138 per square foot. 3257 W Outer Dr is a home located in Wayne County with nearby schools including Pasteur Elementary School, Charles L. Spain Elementary-Middle School, and Edward 'Duke' Ellington Conservatory of Music and Art.
Ownership History
Date
Name
Owned For
Owner Type
Purchase Details
Closed on
May 20, 2010
Sold by
Ramsey Cherron
Bought by
Federal Home Loan Mortgage Corp
Current Estimated Value
Purchase Details
Closed on
Aug 12, 2008
Sold by
Nbj Investment Group
Bought by
Ramsey Cherron
Purchase Details
Closed on
May 23, 2008
Sold by
Jones Barbara
Bought by
Nbj Investment Group
Purchase Details
Closed on
Apr 11, 2008
Sold by
Jones Nkosi and Jones Tiffany
Bought by
Jones Barbara
Purchase Details
Closed on
Feb 25, 2008
Sold by
Jones Nkosi
Bought by
Ramsey Cherron
Purchase Details
Closed on
Feb 14, 2008
Sold by
Washington Mutual Bank
Bought by
Jones Nkosi
Purchase Details
Closed on
Jan 31, 2007
Sold by
Kidd Stephanie
Bought by
Washington Mutual Bank and Long Beach Mortgage Co
Purchase Details
Closed on
Apr 17, 2006
Sold by
Horn Horace and Horn Jackulene
Bought by
Kidd Stephanie
Create a Home Valuation Report for This Property
The Home Valuation Report is an in-depth analysis detailing your home's value as well as a comparison with similar homes in the area
Home Values in the Area
Average Home Value in this Area
Purchase History
| Date | Buyer | Sale Price | Title Company |
|---|---|---|---|
| Federal Home Loan Mortgage Corp | $97,920 | None Available | |
| Ramsey Cherron | -- | None Available | |
| Nbj Investment Group | -- | None Available | |
| Nbj Investment Group | -- | None Available | |
| Jones Barbara | -- | None Available | |
| Ramsey Cherron | -- | None Available | |
| Jones Nkosi | $25,000 | Service Link | |
| Washington Mutual Bank | $192,327 | None Available | |
| Kidd Stephanie | $200,000 | Wilson Title Agency |
Source: Public Records
Tax History
| Year | Tax Paid | Tax Assessment Tax Assessment Total Assessment is a certain percentage of the fair market value that is determined by local assessors to be the total taxable value of land and additions on the property. | Land | Improvement |
|---|---|---|---|---|
| 2025 | $3,252 | $63,400 | $0 | $0 |
| 2024 | $3,313 | $52,300 | $0 | $0 |
| 2023 | $1,185 | $40,400 | $0 | $0 |
| 2022 | $1,297 | $31,700 | $0 | $0 |
| 2021 | $1,265 | $26,500 | $0 | $0 |
| 2020 | $1,251 | $22,800 | $0 | $0 |
| 2019 | $1,232 | $17,200 | $0 | $0 |
| 2018 | $1,051 | $14,900 | $0 | $0 |
| 2017 | $256 | $13,500 | $0 | $0 |
| 2016 | $1,904 | $28,100 | $0 | $0 |
| 2015 | $2,470 | $24,700 | $0 | $0 |
| 2013 | $3,431 | $34,313 | $0 | $0 |
| 2010 | -- | $55,958 | $1,370 | $54,588 |
Source: Public Records
Map
Nearby Homes
- 19372 Santa Barbara Dr
- 19206 Pennington Dr
- 19489 San Juan Dr
- 19136 Santa Barbara Dr
- 19710 Woodingham Dr
- 19786 Pennington Dr
- 19758 Prairie St
- 18968 Pennington Dr
- 18961 Pennington Dr
- 19498 Santa Rosa Dr
- 18966 San Juan Dr
- 18961 Santa Barbara Dr
- 18944 Santa Barbara Dr
- 19580 Roselawn St
- 19928 Santa Barbara Dr
- 8060 Pembroke Ave
- 19940 Prairie St
- 19977 Santa Barbara Dr
- 18709 San Juan Dr
- 18951 Santa Rosa Dr
- 3265 W Outer Dr
- 3275 W Outer Dr
- 19379 Pennington Dr
- 3281 W Outer Dr
- 3235 W Outer Dr
- 3227 W Outer Dr
- 19371 Pennington Dr
- 19378 Pennington Dr
- 3221 W Outer Dr
- 19372 Pennington Dr
- 19361 Pennington Dr
- 19378 Santa Barbara Dr
- 19378 Santa Barbara Dr
- 3291 W Outer Dr
- 3211 W Outer Dr
- 3303 W Outer Dr
- 19366 Pennington Dr
- 19353 Pennington Dr
- 19360 Pennington Dr
- 19366 Santa Barbara Dr
Your Personal Tour Guide
Ask me questions while you tour the home.