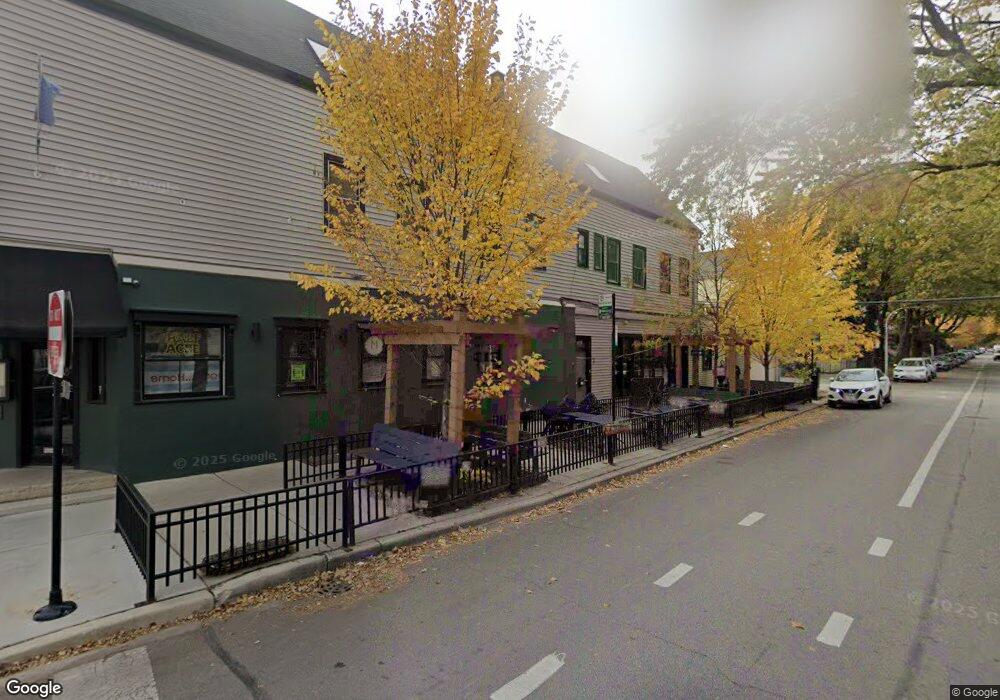
3258 N Southport Ave Chicago, IL 60657
Southport Corridor NeighborhoodEstimated Value: $539,000 - $1,469,000
4
Beds
5
Baths
7,430
Sq Ft
$150/Sq Ft
Est. Value
About This Home
This home is located at 3258 N Southport Ave, Chicago, IL 60657 and is currently estimated at $1,115,708, approximately $150 per square foot. 3258 N Southport Ave is a home located in Cook County with nearby schools including Augustus H. Burley Elementary School, Lake View High School, and Saint Luke Academy.
Ownership History
Date
Name
Owned For
Owner Type
Purchase Details
Closed on
Jun 15, 2018
Sold by
Granite Holdings L L C
Bought by
Sqoolyard Llc
Current Estimated Value
Purchase Details
Closed on
Oct 26, 2001
Sold by
Omalley Matthew A and Mulchrone Robert
Bought by
Granite Holdings Llc
Home Financials for this Owner
Home Financials are based on the most recent Mortgage that was taken out on this home.
Original Mortgage
$630,000
Interest Rate
6.5%
Mortgage Type
Commercial
Purchase Details
Closed on
Apr 13, 2001
Sold by
State Bank Of Countryside
Bought by
State Bank Of Countryside and Trust #01-2285
Purchase Details
Closed on
Jul 12, 1994
Sold by
Johnson Ann E
Bought by
Standard Bank & Trust Company
Home Financials for this Owner
Home Financials are based on the most recent Mortgage that was taken out on this home.
Original Mortgage
$225,000
Interest Rate
8.6%
Mortgage Type
Commercial
Create a Home Valuation Report for This Property
The Home Valuation Report is an in-depth analysis detailing your home's value as well as a comparison with similar homes in the area
Home Values in the Area
Average Home Value in this Area
Purchase History
| Date | Buyer | Sale Price | Title Company |
|---|---|---|---|
| Sqoolyard Llc | $1,000,000 | Attorney | |
| Granite Holdings Llc | $1,060,000 | -- | |
| Omalley Matthew A | -- | -- | |
| State Bank Of Countryside | -- | -- | |
| Standard Bank & Trust Company | $275,000 | -- |
Source: Public Records
Mortgage History
| Date | Status | Borrower | Loan Amount |
|---|---|---|---|
| Previous Owner | Granite Holdings Llc | $630,000 | |
| Previous Owner | Standard Bank & Trust Company | $225,000 | |
| Closed | Granite Holdings Llc | $441,000 |
Source: Public Records
Tax History Compared to Growth
Tax History
| Year | Tax Paid | Tax Assessment Tax Assessment Total Assessment is a certain percentage of the fair market value that is determined by local assessors to be the total taxable value of land and additions on the property. | Land | Improvement |
|---|---|---|---|---|
| 2024 | $26,477 | $151,000 | $55,800 | $95,200 |
| 2023 | $25,796 | $122,000 | $45,000 | $77,000 |
| 2022 | $25,796 | $122,000 | $45,000 | $77,000 |
| 2021 | $25,203 | $122,000 | $45,000 | $77,000 |
| 2020 | $20,592 | $90,000 | $19,200 | $70,800 |
| 2019 | $20,666 | $100,000 | $19,200 | $80,800 |
| 2018 | $20,318 | $100,000 | $19,200 | $80,800 |
| 2017 | $21,774 | $98,255 | $16,800 | $81,455 |
| 2016 | $20,291 | $98,255 | $16,800 | $81,455 |
| 2015 | $18,603 | $98,255 | $16,800 | $81,455 |
| 2014 | $17,646 | $91,815 | $13,800 | $78,015 |
| 2013 | $17,310 | $91,815 | $13,800 | $78,015 |
Source: Public Records
Map
Nearby Homes
- 1322 W Belmont Ave Unit 2W
- 1316 W Belmont Ave Unit 2E
- 1429 W Henderson St Unit 1
- 1425 W Belmont Ave Unit 3
- 1442 W Belmont Ave Unit 2E
- 1455 W Melrose St Unit 1
- 1437 W Belmont Ave Unit 4
- 3505 N Greenview Ave
- 3133 N Lakewood Ave Unit 2E
- 1447 W Roscoe St Unit PH
- 1447 W Roscoe St Unit 1
- 1424 W Barry Ave
- 1541 W Henderson St Unit D
- 3434 N Southport Ave Unit 2
- 3059 N Lincoln Ave Unit B
- 3118 N Lincoln Ave Unit 4A
- 1150 W School St Unit 1150
- 3037 N Lincoln Ave Unit 201
- 3037 N Lincoln Ave Unit PH-01
- 3037 N Lincoln Ave Unit PH-04
- 3256 N Southport Ave
- 3256 N Southport Ave Unit 3
- 3256 N Southport Ave Unit 1
- 3256 N Southport Ave Unit 2
- 3252 N Southport Ave Unit 2
- 3252 N Southport Ave
- 3252 N Southport Ave
- 3250 N Southport Ave Unit 1
- 3250 N Southport Ave Unit 2
- 3250 N Southport Ave
- 3015-17 N Southport Ave
- 3300 N Southport Ave
- 3248 N Southport Ave
- 1415 W School St
- 3304 N Southport Ave
- 3304 N Southport Ave Unit 2
- 3304 N Southport Ave
- 3246 N Southport Ave
- 1417 W School St
- 3244 N Southport Ave