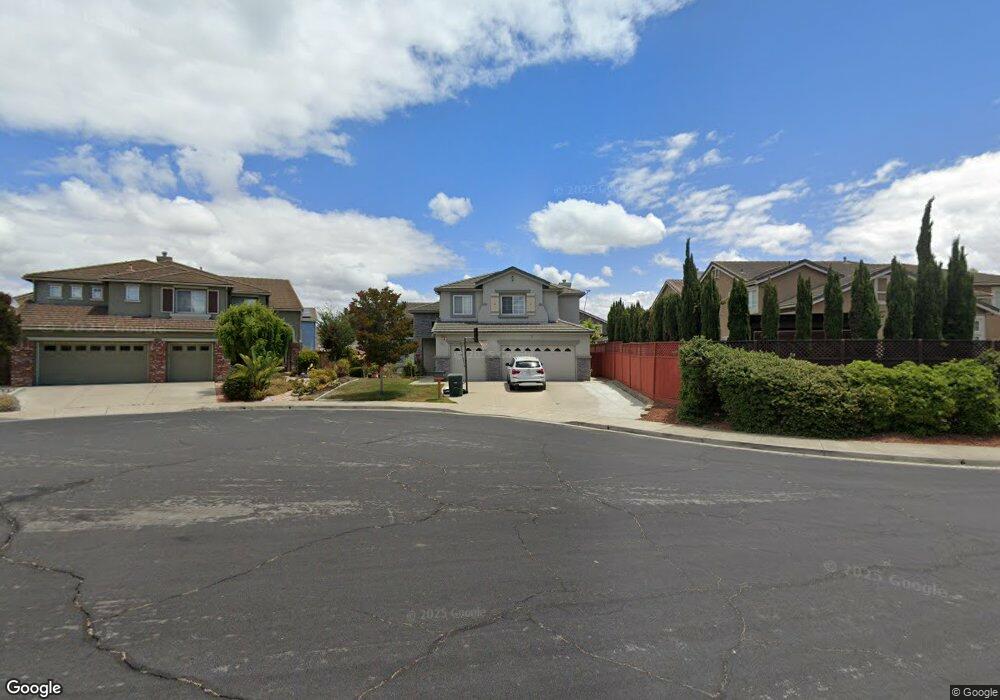
32581 Point Lobos Ct Union City, CA 94587
Alvarado NeighborhoodEstimated Value: $1,971,000 - $2,155,000
5
Beds
3
Baths
2,814
Sq Ft
$741/Sq Ft
Est. Value
About This Home
This home is located at 32581 Point Lobos Ct, Union City, CA 94587 and is currently estimated at $2,084,058, approximately $740 per square foot. 32581 Point Lobos Ct is a home located in Alameda County with nearby schools including Delaine Eastin Elementary School, Itliong-Vera Cruz, and James Logan High School.
Ownership History
Date
Name
Owned For
Owner Type
Purchase Details
Closed on
Nov 20, 2020
Sold by
Wong Chuck and Wong Kin
Bought by
Wong Chuck and Wong Kin
Current Estimated Value
Home Financials for this Owner
Home Financials are based on the most recent Mortgage that was taken out on this home.
Original Mortgage
$280,000
Outstanding Balance
$202,246
Interest Rate
2.8%
Mortgage Type
New Conventional
Estimated Equity
$1,881,812
Purchase Details
Closed on
Oct 29, 2016
Sold by
Wong Chuck and Wong Kin
Bought by
Wong Chuck and Wong Kin
Purchase Details
Closed on
Oct 15, 2010
Sold by
Iyengar Nandakumar and Iyengar Anupama
Bought by
Wong Chuck and Wong Kin
Home Financials for this Owner
Home Financials are based on the most recent Mortgage that was taken out on this home.
Original Mortgage
$627,843
Outstanding Balance
$413,466
Interest Rate
4.31%
Mortgage Type
New Conventional
Estimated Equity
$1,670,592
Create a Home Valuation Report for This Property
The Home Valuation Report is an in-depth analysis detailing your home's value as well as a comparison with similar homes in the area
Home Values in the Area
Average Home Value in this Area
Purchase History
| Date | Buyer | Sale Price | Title Company |
|---|---|---|---|
| Wong Chuck | -- | Wfg National Title Ins Co | |
| Wong Chuck | -- | Wfg National Title Ins Co | |
| Wong Chuck | -- | None Available | |
| Wong Chuck | $785,000 | Fidelity National Title Co |
Source: Public Records
Mortgage History
| Date | Status | Borrower | Loan Amount |
|---|---|---|---|
| Open | Wong Chuck | $280,000 | |
| Open | Wong Chuck | $627,843 |
Source: Public Records
Tax History Compared to Growth
Tax History
| Year | Tax Paid | Tax Assessment Tax Assessment Total Assessment is a certain percentage of the fair market value that is determined by local assessors to be the total taxable value of land and additions on the property. | Land | Improvement |
|---|---|---|---|---|
| 2025 | $13,725 | $998,663 | $301,699 | $703,964 |
| 2024 | $13,725 | $978,951 | $295,785 | $690,166 |
| 2023 | $13,322 | $966,624 | $289,987 | $676,637 |
| 2022 | $13,110 | $940,674 | $284,302 | $663,372 |
| 2021 | $12,819 | $922,094 | $278,728 | $650,366 |
| 2020 | $12,537 | $919,571 | $275,871 | $643,700 |
| 2019 | $12,670 | $901,548 | $270,464 | $631,084 |
| 2018 | $12,381 | $883,878 | $265,163 | $618,715 |
| 2017 | $12,088 | $866,553 | $259,966 | $606,587 |
| 2016 | $11,648 | $849,565 | $254,869 | $594,696 |
| 2015 | $11,434 | $836,810 | $251,043 | $585,767 |
| 2014 | $11,007 | $820,418 | $246,125 | $574,293 |
Source: Public Records
Map
Nearby Homes
- 32447 Pacific Grove Way
- 32409 Elizabeth Way
- 4639 Michelle Ct
- 4633 Granada Way
- 4506 Birchwood Ct
- 4611 Carmen Way
- 32451 Regents Blvd
- 4532 Delores Dr
- 4201 Saturn Way
- 4263 Queen Anne Dr
- 4214 Saturn Way
- 4167 Sunflower Ct
- 32945 Regents Blvd
- 4243 Comet Cir
- 4100 Aquarius Cir
- 4231 Hanford St
- 34102 Zaner Way
- 33018 Soquel St
- 33064 Compton Ct
- 30921 Union City Blvd Unit 30927
- 32579 Point Lobos Ct
- 5503 Point Lobos Ct
- 5507 Point Lobos Ct
- 32576 Carmel Way
- 32580 Carmel Way
- 32572 Carmel Way
- 32584 Carmel Way
- 32575 Point Lobos Ct
- 32568 Carmel Way
- 32570 Point Lobos Ct
- 32564 Carmel Way
- 32582 Point Lobos Ct
- 32586 Point Lobos Ct
- 32574 Point Lobos Ct
- 32590 Point Lobos Ct
- 32578 Point Lobos Ct
- 32621 Singh Cir
- 32560 Carmel Way
- 2 NW Carpenter St
- 0 Carpenter 2 SE Unit ML748692