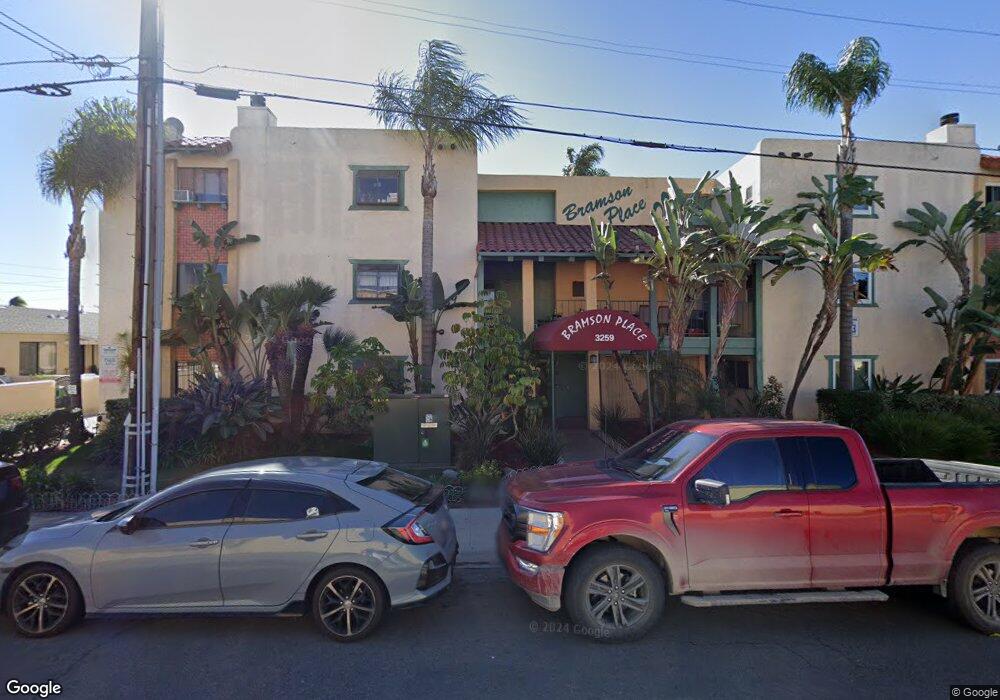
3259 Bramson Place Unit 104 San Diego, CA 92104
Corridor NeighborhoodEstimated Value: $442,438 - $533,000
1
Bed
1
Bath
766
Sq Ft
$629/Sq Ft
Est. Value
About This Home
This home is located at 3259 Bramson Place Unit 104, San Diego, CA 92104 and is currently estimated at $482,110, approximately $629 per square foot. 3259 Bramson Place Unit 104 is a home located in San Diego County with nearby schools including Edison Elementary School, Wilson Middle School, and Herbert Hoover High School.
Ownership History
Date
Name
Owned For
Owner Type
Purchase Details
Closed on
Oct 17, 2018
Sold by
Ward Rochelle N
Bought by
Ward Rochelle N
Current Estimated Value
Purchase Details
Closed on
Jul 17, 2002
Sold by
3259 Bramson Llc
Bought by
Ward Rochelle N
Home Financials for this Owner
Home Financials are based on the most recent Mortgage that was taken out on this home.
Original Mortgage
$29,000
Interest Rate
6.69%
Mortgage Type
Stand Alone Second
Purchase Details
Closed on
Nov 13, 2001
Sold by
M-H Financial
Bought by
3259 Bramson Llc
Home Financials for this Owner
Home Financials are based on the most recent Mortgage that was taken out on this home.
Original Mortgage
$1,600,000
Interest Rate
6.67%
Purchase Details
Closed on
May 31, 1985
Create a Home Valuation Report for This Property
The Home Valuation Report is an in-depth analysis detailing your home's value as well as a comparison with similar homes in the area
Home Values in the Area
Average Home Value in this Area
Purchase History
| Date | Buyer | Sale Price | Title Company |
|---|---|---|---|
| Ward Rochelle N | -- | None Available | |
| Ward Rochelle N | $145,000 | Lawyers Title | |
| 3259 Bramson Llc | $2,200,000 | Commonwealth Land Title Co | |
| M-H Financial | -- | Commonwealth Land Title Co | |
| -- | $44,000 | -- |
Source: Public Records
Mortgage History
| Date | Status | Borrower | Loan Amount |
|---|---|---|---|
| Closed | Ward Rochelle N | $29,000 | |
| Previous Owner | 3259 Bramson Llc | $1,600,000 | |
| Closed | 3259 Bramson Llc | $319,600 |
Source: Public Records
Tax History Compared to Growth
Tax History
| Year | Tax Paid | Tax Assessment Tax Assessment Total Assessment is a certain percentage of the fair market value that is determined by local assessors to be the total taxable value of land and additions on the property. | Land | Improvement |
|---|---|---|---|---|
| 2025 | $2,480 | $209,994 | $86,893 | $123,101 |
| 2024 | $2,480 | $205,878 | $85,190 | $120,688 |
| 2023 | $2,423 | $201,842 | $83,520 | $118,322 |
| 2022 | $2,357 | $197,885 | $81,883 | $116,002 |
| 2021 | $2,340 | $194,006 | $80,278 | $113,728 |
| 2020 | $2,311 | $192,017 | $79,455 | $112,562 |
| 2019 | $2,268 | $188,253 | $77,898 | $110,355 |
| 2018 | $2,121 | $184,563 | $76,371 | $108,192 |
| 2017 | $2,069 | $180,945 | $74,874 | $106,071 |
| 2016 | $2,034 | $177,398 | $73,406 | $103,992 |
| 2015 | $2,003 | $174,734 | $72,304 | $102,430 |
| 2014 | $1,837 | $160,000 | $62,000 | $98,000 |
Source: Public Records
Map
Nearby Homes
- 3245 Bramson Place
- 4205 Ohio St Unit 204
- 4205 Ohio St Unit 106
- 4416-18 34th St
- 4252 35th St Unit 6
- 4366 Ohio St
- 4175 35th St
- 4347 30th St Unit 53
- 4048-50 35th St
- 4332 Wilson Ave
- 4074 30th St
- 4119-23 Kansas
- 3950 Ohio St Unit 507
- 4153 Wilson Ave
- 3864 35th St
- 4473 30th St Unit 506
- 4473 30th St Unit 407
- 4473 30th St Unit 218
- 4473 30th St Unit 505
- 4473 30th St Unit 402
- 3259 Bramson Place
- 3259 Bramson Place
- 3259 Bramson Place Unit 214
- 3259 Bramson Place Unit 213
- 3259 Bramson Place Unit 212
- 3259 Bramson Place Unit 211
- 3259 Bramson Place Unit 210
- 3259 Bramson Place Unit 209
- 3259 Bramson Place Unit 208
- 3259 Bramson Place Unit 207
- 3259 Bramson Place Unit 206
- 3259 Bramson Place Unit 205
- 3259 Bramson Place Unit 204
- 3259 Bramson Place Unit 203
- 3259 Bramson Place Unit 202
- 3259 Bramson Place Unit 201
- 3259 Bramson Place Unit 105
- 3259 Bramson Place Unit 103
- 3259 Bramson Place Unit 102
- 3259 Bramson Place Unit 101