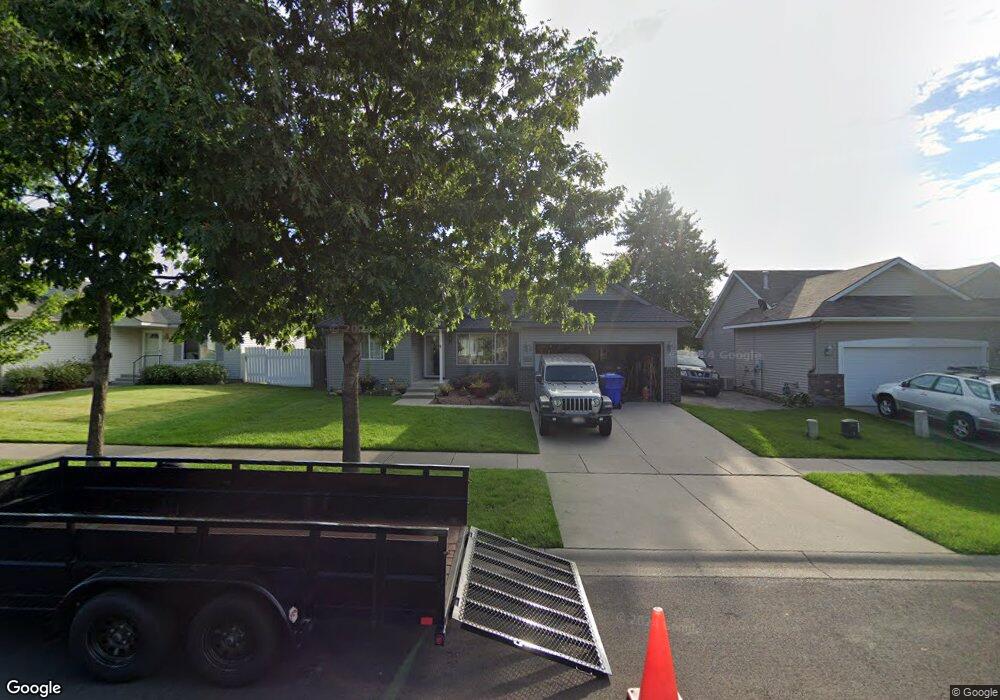
3259 N Alfalfa Loop Post Falls, ID 83854
North Prairie NeighborhoodEstimated Value: $416,728 - $441,000
3
Beds
2
Baths
1,186
Sq Ft
$362/Sq Ft
Est. Value
About This Home
This home is located at 3259 N Alfalfa Loop, Post Falls, ID 83854 and is currently estimated at $429,182, approximately $361 per square foot. 3259 N Alfalfa Loop is a home located in Kootenai County with nearby schools including Prairie View Elementary School, Post Falls Middle School, and Post Falls High School.
Ownership History
Date
Name
Owned For
Owner Type
Purchase Details
Closed on
May 30, 2023
Sold by
Fomasi Connie Lynn
Bought by
Zehetmir Beau Blake
Current Estimated Value
Purchase Details
Closed on
Feb 17, 2016
Sold by
Jmj Property Llc
Bought by
Fomasi Connie L
Home Financials for this Owner
Home Financials are based on the most recent Mortgage that was taken out on this home.
Original Mortgage
$164,421
Interest Rate
3.97%
Mortgage Type
New Conventional
Purchase Details
Closed on
Oct 4, 2006
Sold by
Gobin Steve and Gobin Maureen
Bought by
Jmj Property Llc
Home Financials for this Owner
Home Financials are based on the most recent Mortgage that was taken out on this home.
Original Mortgage
$131,600
Interest Rate
6.43%
Mortgage Type
New Conventional
Purchase Details
Closed on
Jan 26, 2006
Sold by
Hayman Kacee Jo
Bought by
Baker Russell
Create a Home Valuation Report for This Property
The Home Valuation Report is an in-depth analysis detailing your home's value as well as a comparison with similar homes in the area
Home Values in the Area
Average Home Value in this Area
Purchase History
| Date | Buyer | Sale Price | Title Company |
|---|---|---|---|
| Zehetmir Beau Blake | -- | None Listed On Document | |
| Fomasi Connie L | -- | First American Title Company | |
| Jmj Property Llc | -- | -- | |
| Gobin Steve | -- | -- | |
| Baker Russell | -- | -- |
Source: Public Records
Mortgage History
| Date | Status | Borrower | Loan Amount |
|---|---|---|---|
| Previous Owner | Fomasi Connie L | $164,421 | |
| Previous Owner | Gobin Steve | $131,600 |
Source: Public Records
Tax History
| Year | Tax Paid | Tax Assessment Tax Assessment Total Assessment is a certain percentage of the fair market value that is determined by local assessors to be the total taxable value of land and additions on the property. | Land | Improvement |
|---|---|---|---|---|
| 2025 | $2,256 | $372,580 | $175,000 | $197,580 |
| 2024 | $2,363 | $374,740 | $152,000 | $222,740 |
| 2023 | $2,363 | $400,560 | $160,000 | $240,560 |
| 2022 | $1,877 | $424,788 | $157,500 | $267,288 |
| 2021 | $1,512 | $270,260 | $105,000 | $165,260 |
| 2020 | $1,594 | $236,180 | $90,000 | $146,180 |
| 2019 | $1,410 | $207,830 | $90,000 | $117,830 |
| 2018 | $1,289 | $177,450 | $70,000 | $107,450 |
| 2017 | $1,231 | $154,870 | $50,000 | $104,870 |
| 2016 | $1,169 | $138,620 | $40,000 | $98,620 |
| 2015 | $2,212 | $134,810 | $37,000 | $97,810 |
| 2013 | $2,083 | $117,250 | $32,000 | $85,250 |
Source: Public Records
Map
Nearby Homes
- 2815 N Sand Trap Way
- 2533 N Side Saddle Ln
- 2325 N Mackenzie Dr
- 2489 N Side Saddle Ln
- 2744 N Alfalfa Loop
- 2770 N Slice
- 908 E Allenby Ct
- 984 E Allenby Ave
- 561 E Sand Wedge Dr
- 880 E Allenby Ct
- 1074 E Allenby Ave
- 2435 N Bunchgrass Dr
- 910 E Shasta Ave
- 2103 N Mackenzie Dr
- 1039 E Blair Ave
- 1412 E Allenby Ave
- 2441 N Henry St
- 3752 N Shelburne Loop
- 2110 N Triumph Ct
- 3265 N Segar Loop
- 3239 N Alfalfa Loop
- 3275 N Alfalfa Loop
- 3221 N Alfalfa Loop
- 3295 N Alfalfa Loop
- 2827 N Ivy Ln
- 2845 N Ivy Ln
- 2809 N Ivy Ln
- 3258 N Alfalfa Loop
- 3240 N Alfalfa Loop
- 3203 N Alfalfa Loop
- 2789 N Ivy Ln
- 2869 N Ivy Ln
- 3274 N Alfalfa Loop
- 2877 Ivy Ln
- 3222 N Alfalfa Loop
- 3294 N Alfalfa Loop
- 3181 N Alfalfa Loop
- 3312 N Alfalfa Loop
- 2771 N Ivy Ln
- 2755 N Ivy Ln
Your Personal Tour Guide
Ask me questions while you tour the home.