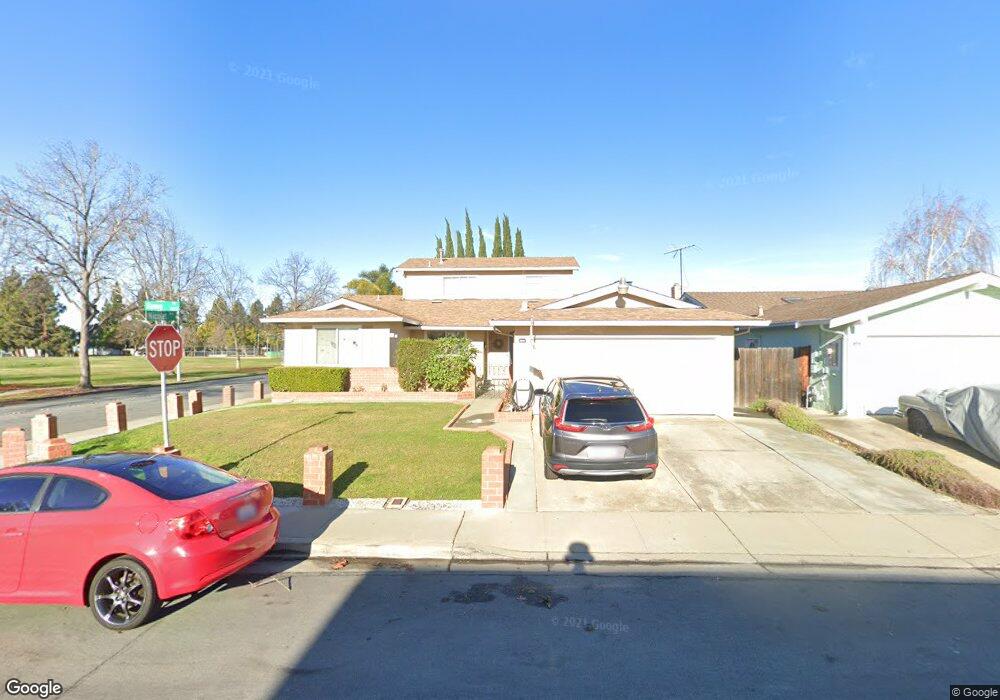
3259 Rowe Place Fremont, CA 94536
Brookvale NeighborhoodEstimated Value: $1,936,000 - $2,180,000
5
Beds
3
Baths
2,265
Sq Ft
$905/Sq Ft
Est. Value
About This Home
This home is located at 3259 Rowe Place, Fremont, CA 94536 and is currently estimated at $2,050,427, approximately $905 per square foot. 3259 Rowe Place is a home located in Alameda County with nearby schools including Brookvale Elementary School, Thornton Middle School, and American High School.
Ownership History
Date
Name
Owned For
Owner Type
Purchase Details
Closed on
Jul 19, 2018
Sold by
Olson Evelyn C and The Olson Irrevocable Trust
Bought by
Olson Evelyn C and Albert And Evelyn Olson Trust
Current Estimated Value
Purchase Details
Closed on
Jul 11, 2001
Sold by
Olson Evelyn C and Albert & Evelyn Olson Trust
Bought by
Olson Evelyn C and The Olson Irrevocable Trust
Home Financials for this Owner
Home Financials are based on the most recent Mortgage that was taken out on this home.
Original Mortgage
$318,500
Interest Rate
7.62%
Purchase Details
Closed on
Jan 27, 2000
Sold by
Olson Evelyn C
Bought by
Olson Evelyn C and Olson Irrevocable Trust
Purchase Details
Closed on
Jun 1, 1998
Sold by
Olson Albert M 2Nd & Evelyn C
Bought by
Olson Albert M and Olson Evelyn C
Home Financials for this Owner
Home Financials are based on the most recent Mortgage that was taken out on this home.
Original Mortgage
$130,000
Interest Rate
7.1%
Create a Home Valuation Report for This Property
The Home Valuation Report is an in-depth analysis detailing your home's value as well as a comparison with similar homes in the area
Home Values in the Area
Average Home Value in this Area
Purchase History
| Date | Buyer | Sale Price | Title Company |
|---|---|---|---|
| Olson Evelyn C | -- | None Available | |
| Olson Evelyn C | -- | None Available | |
| Olson Evelyn C | -- | New Century Title Company | |
| Olson Evelyn C | -- | -- | |
| Olson Albert M | -- | Commonwealth Land Title Co | |
| Olson Albert M | -- | Commonwealth Land Title Co |
Source: Public Records
Mortgage History
| Date | Status | Borrower | Loan Amount |
|---|---|---|---|
| Previous Owner | Olson Evelyn C | $318,500 | |
| Previous Owner | Olson Albert M | $130,000 |
Source: Public Records
Tax History Compared to Growth
Tax History
| Year | Tax Paid | Tax Assessment Tax Assessment Total Assessment is a certain percentage of the fair market value that is determined by local assessors to be the total taxable value of land and additions on the property. | Land | Improvement |
|---|---|---|---|---|
| 2025 | $1,999 | $106,000 | $23,314 | $82,686 |
| 2024 | $1,999 | $103,921 | $22,856 | $81,065 |
| 2023 | $1,926 | $101,883 | $22,408 | $79,475 |
| 2022 | $1,874 | $99,886 | $21,969 | $77,917 |
| 2021 | $1,836 | $97,928 | $21,538 | $76,390 |
| 2020 | $1,749 | $96,924 | $21,317 | $75,607 |
| 2019 | $1,734 | $95,024 | $20,900 | $74,124 |
| 2018 | $1,698 | $93,161 | $20,490 | $72,671 |
| 2017 | $1,657 | $91,334 | $20,088 | $71,246 |
| 2016 | $1,614 | $89,543 | $19,694 | $69,849 |
| 2015 | $1,580 | $88,198 | $19,398 | $68,800 |
| 2014 | $1,543 | $86,471 | $19,018 | $67,453 |
Source: Public Records
Map
Nearby Homes
- 3155 Mackenzie Place
- 3751 Ruskin Place
- 3371 Baywood Terrace Unit 214
- 3663 Oakwood Terrace Unit 211
- 3530 Oakwood Terrace Unit 102
- 3443 Pepperwood Terrace Unit 301
- 3507 Buttonwood Terrace Unit 203
- 35415 Woodbridge Place
- 35383 Purcell Place
- Plan 1725 at Veranda
- Plan 1670 at Veranda
- Plan 1657 at Veranda
- Plan 1629 at Veranda
- Plan 1455 at Veranda
- Plan 1394 at Veranda
- Plan 1378 at Veranda
- Plan 1165 at Veranda
- 3184 Waugh Place
- 4412 Elaiso Common
- 4543 Bartolo Terrace
- 3221 Rowe Place
- 3258 Puttenham Way
- 3242 Puttenham Way
- 3213 Rowe Place
- 3252 Rowe Place
- 3218 Puttenham Way
- 3246 Rowe Place
- 3173 Rowe Place
- 3216 Rowe Place
- 3176 Puttenham Way
- 3178 Rowe Place
- 3159 Rowe Place
- 3295 Alder Ave
- 3164 Puttenham Way
- 3257 Puttenham Way
- 3225 Puttenham Way
- 3279 Alder Ave
- 3203 Puttenham Way
- 3263 Alder Ave
- 3160 Rowe Place