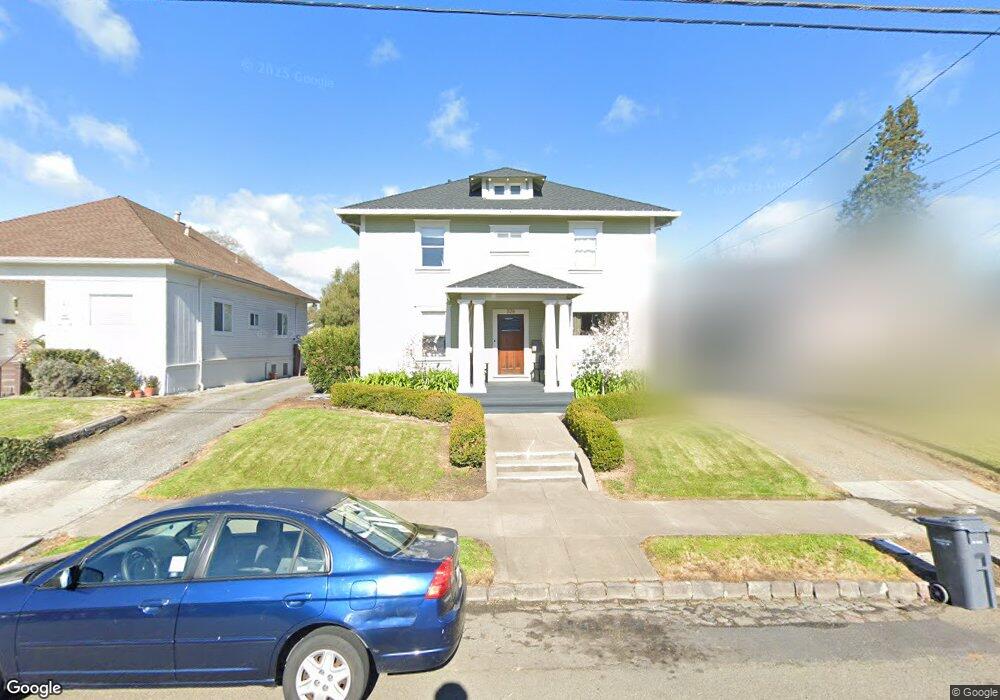
326 Bassett St Petaluma, CA 94952
Western Petaluma NeighborhoodEstimated Value: $996,997 - $1,731,000
6
Beds
2
Baths
2,408
Sq Ft
$526/Sq Ft
Est. Value
About This Home
This home is located at 326 Bassett St, Petaluma, CA 94952 and is currently estimated at $1,266,499, approximately $525 per square foot. 326 Bassett St is a home located in Sonoma County with nearby schools including Valley Vista Elementary School, Petaluma Junior High School, and Petaluma High School.
Ownership History
Date
Name
Owned For
Owner Type
Purchase Details
Closed on
Apr 9, 1998
Sold by
Vanpatten Wayne N and Vanpatten Rhonda L
Bought by
Vanpatten Wayne N and Vanpatten Rhonda L
Current Estimated Value
Purchase Details
Closed on
Jan 13, 1998
Sold by
Carter Marjorie M 1989 Trust and Wayne N
Bought by
Vanpatten Wayne N and Vanpatten Rhonda L
Purchase Details
Closed on
May 2, 1997
Sold by
Carter Majorie M
Bought by
Carter Marjorie M and Marjorie M Carter 1989 Trust
Purchase Details
Closed on
Mar 27, 1997
Sold by
Carter Marjorie M
Bought by
Carter Marjorie M and Marjorie M Carter 1989 Trust
Create a Home Valuation Report for This Property
The Home Valuation Report is an in-depth analysis detailing your home's value as well as a comparison with similar homes in the area
Home Values in the Area
Average Home Value in this Area
Purchase History
| Date | Buyer | Sale Price | Title Company |
|---|---|---|---|
| Vanpatten Wayne N | -- | -- | |
| Vanpatten Wayne N | -- | -- | |
| Carter Marjorie M | -- | -- | |
| Carter Marjorie M | -- | -- |
Source: Public Records
Tax History Compared to Growth
Tax History
| Year | Tax Paid | Tax Assessment Tax Assessment Total Assessment is a certain percentage of the fair market value that is determined by local assessors to be the total taxable value of land and additions on the property. | Land | Improvement |
|---|---|---|---|---|
| 2025 | $904 | $63,435 | $19,841 | $43,594 |
| 2024 | $904 | $62,192 | $19,452 | $42,740 |
| 2023 | $904 | $60,973 | $19,071 | $41,902 |
| 2022 | $801 | $59,779 | $18,698 | $41,081 |
| 2021 | $789 | $58,608 | $18,332 | $40,276 |
| 2020 | $795 | $58,009 | $18,145 | $39,864 |
| 2019 | $787 | $56,873 | $17,790 | $39,083 |
| 2018 | $784 | $55,759 | $17,442 | $38,317 |
| 2017 | $771 | $54,666 | $17,100 | $37,566 |
| 2016 | $745 | $53,595 | $16,765 | $36,830 |
| 2015 | $736 | $52,791 | $16,514 | $36,277 |
| 2014 | $733 | $51,758 | $16,191 | $35,567 |
Source: Public Records
Map
Nearby Homes