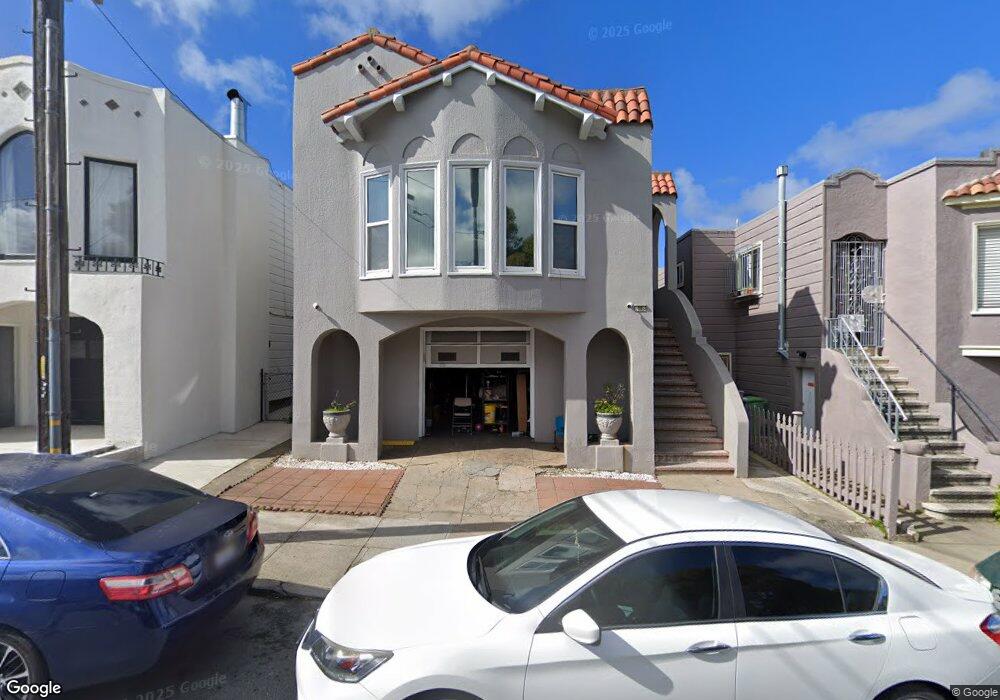
326 Bowdoin St San Francisco, CA 94134
Portola NeighborhoodEstimated Value: $987,225 - $1,195,000
2
Beds
1
Bath
1,350
Sq Ft
$820/Sq Ft
Est. Value
About This Home
This home is located at 326 Bowdoin St, San Francisco, CA 94134 and is currently estimated at $1,107,306, approximately $820 per square foot. 326 Bowdoin St is a home located in San Francisco County with nearby schools including Hillcrest Elementary School, King Jr. (Martin Luther) Academic Middle School, and San Francisco School.
Ownership History
Date
Name
Owned For
Owner Type
Purchase Details
Closed on
Mar 12, 2021
Sold by
Perez Ramiro and Perez Martha
Bought by
Velazquez Olivia and Olivia Velazquez Living Trust
Current Estimated Value
Home Financials for this Owner
Home Financials are based on the most recent Mortgage that was taken out on this home.
Original Mortgage
$206,500
Outstanding Balance
$153,061
Interest Rate
2.7%
Mortgage Type
New Conventional
Estimated Equity
$954,245
Purchase Details
Closed on
Mar 26, 2011
Sold by
Velazquez Olivia
Bought by
Velazquez Olivia
Purchase Details
Closed on
Oct 21, 2009
Sold by
Perez Martha
Bought by
Velazquez Olivia C D and Perez Ramiro
Home Financials for this Owner
Home Financials are based on the most recent Mortgage that was taken out on this home.
Original Mortgage
$264,000
Interest Rate
5%
Mortgage Type
New Conventional
Purchase Details
Closed on
Aug 1, 2006
Sold by
Velazquez Jesus J
Bought by
Velazquez Olivia C D
Create a Home Valuation Report for This Property
The Home Valuation Report is an in-depth analysis detailing your home's value as well as a comparison with similar homes in the area
Home Values in the Area
Average Home Value in this Area
Purchase History
| Date | Buyer | Sale Price | Title Company |
|---|---|---|---|
| Velazquez Olivia | -- | Fidelity National Title | |
| Perez Ramiro | -- | Fidelity National Title | |
| Velazquez Olivia | -- | None Available | |
| Velazquez Olivia C D | $66,000 | None Available | |
| Perez Martha | -- | Fidelity National Title Co | |
| Velazquez Olivia C D | -- | Chicago Title Co |
Source: Public Records
Mortgage History
| Date | Status | Borrower | Loan Amount |
|---|---|---|---|
| Open | Perez Ramiro | $206,500 | |
| Closed | Perez Martha | $264,000 |
Source: Public Records
Tax History Compared to Growth
Tax History
| Year | Tax Paid | Tax Assessment Tax Assessment Total Assessment is a certain percentage of the fair market value that is determined by local assessors to be the total taxable value of land and additions on the property. | Land | Improvement |
|---|---|---|---|---|
| 2025 | $4,646 | $335,777 | $146,011 | $189,766 |
| 2024 | $4,646 | $329,197 | $143,150 | $186,047 |
| 2023 | $4,567 | $322,745 | $140,344 | $182,401 |
| 2022 | $4,466 | $316,420 | $137,594 | $178,826 |
| 2021 | $4,382 | $310,219 | $134,898 | $175,321 |
| 2020 | $4,470 | $307,040 | $133,516 | $173,524 |
| 2019 | $4,273 | $301,024 | $130,900 | $170,124 |
| 2018 | $4,130 | $295,078 | $128,305 | $166,773 |
| 2017 | $3,783 | $289,295 | $125,791 | $163,504 |
| 2016 | $3,697 | $283,625 | $123,326 | $160,299 |
| 2015 | $3,649 | $279,368 | $121,475 | $157,893 |
| 2014 | $3,555 | $273,900 | $119,098 | $154,802 |
Source: Public Records
Map
Nearby Homes
- 46 Dartmouth St
- 1029 Silver Ave
- 50 University St
- 920 Felton St
- 120 Princeton St
- 4243 Folsom St
- 334 Alemany Blvd Unit 3
- 881 Moultrie St
- 886 Moultrie St
- 548 Burrows St
- 151 Sweeny St
- 132 Bache St
- 4190 Folsom St
- 141 Porter St
- 4136 Folsom St
- 131 Brussels St
- 607 Anderson St
- 456 Nevada St
- 406 Goettingen St
- 1383 Bacon St
- 318 Bowdoin St
- 312 Bowdoin St
- 340 Bowdoin St
- 47 Dartmouth St
- 51 Dartmouth St
- 43 Dartmouth St
- 310 Bowdoin St
- 57 Dartmouth St
- 39 Dartmouth St
- 1201 Silver Ave
- 35 Dartmouth St
- 1163 Silver Ave Unit 1165
- 300 Bowdoin St
- 325 Bowdoin St
- 31 Dartmouth St
- 290 Bowdoin St
- 387 Hale St
- 27 Dartmouth St
- 1215 Silver Ave
- 1190 Silver Ave