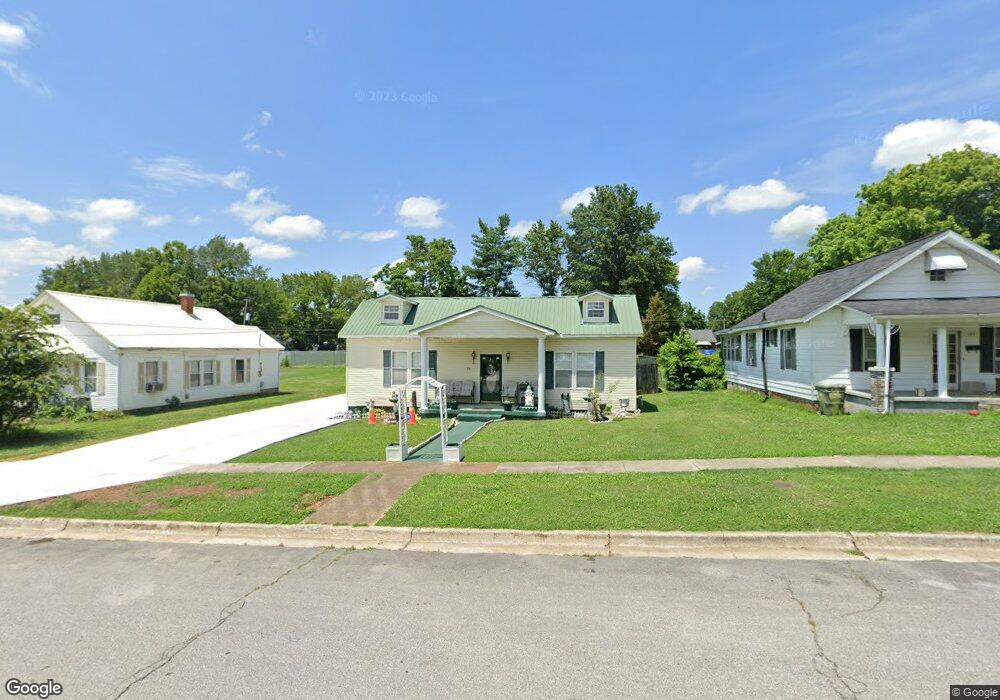
326 Deller St Lawrenceburg, TN 38464
Estimated Value: $147,844 - $199,000
--
Bed
1
Bath
1,332
Sq Ft
$134/Sq Ft
Est. Value
About This Home
This home is located at 326 Deller St, Lawrenceburg, TN 38464 and is currently estimated at $178,711, approximately $134 per square foot. 326 Deller St is a home located in Lawrence County with nearby schools including Ingram Sowell Elementary School, David Crockett Elementary School, and Lawrenceburg Public Elementary School.
Ownership History
Date
Name
Owned For
Owner Type
Purchase Details
Closed on
Jul 24, 2024
Sold by
Wallace Michael
Bought by
Wallace Michael and Wallace Barbara
Current Estimated Value
Purchase Details
Closed on
Apr 3, 2003
Sold by
Etal Wallace Kenneth
Bought by
Michael Wallace
Home Financials for this Owner
Home Financials are based on the most recent Mortgage that was taken out on this home.
Original Mortgage
$32,777
Interest Rate
5.82%
Purchase Details
Closed on
Aug 2, 1969
Bought by
Wallace Myrtle
Create a Home Valuation Report for This Property
The Home Valuation Report is an in-depth analysis detailing your home's value as well as a comparison with similar homes in the area
Home Values in the Area
Average Home Value in this Area
Purchase History
| Date | Buyer | Sale Price | Title Company |
|---|---|---|---|
| Wallace Michael | -- | None Listed On Document | |
| Michael Wallace | $34,000 | -- | |
| Wallace Myrtle | -- | -- |
Source: Public Records
Mortgage History
| Date | Status | Borrower | Loan Amount |
|---|---|---|---|
| Previous Owner | Wallace Myrtle | $32,777 |
Source: Public Records
Tax History Compared to Growth
Tax History
| Year | Tax Paid | Tax Assessment Tax Assessment Total Assessment is a certain percentage of the fair market value that is determined by local assessors to be the total taxable value of land and additions on the property. | Land | Improvement |
|---|---|---|---|---|
| 2025 | $768 | $24,700 | $0 | $0 |
| 2024 | $768 | $24,700 | $1,875 | $22,825 |
| 2023 | $768 | $24,700 | $1,875 | $22,825 |
| 2022 | $768 | $24,700 | $1,875 | $22,825 |
| 2021 | $594 | $13,525 | $1,875 | $11,650 |
| 2020 | $594 | $13,525 | $1,875 | $11,650 |
| 2019 | $594 | $13,525 | $1,875 | $11,650 |
| 2018 | $594 | $13,525 | $1,875 | $11,650 |
| 2017 | $594 | $13,525 | $1,875 | $11,650 |
| 2016 | $594 | $13,525 | $1,875 | $11,650 |
| 2015 | $563 | $13,525 | $1,875 | $11,650 |
| 2014 | $533 | $12,800 | $1,875 | $10,925 |
Source: Public Records
Map
Nearby Homes